
Every time Bitcoin's price drops, one line spreads fast across social media and trading groups: "the whales are selling."
But does the on-chain data actually back up that story?
On-chain analysis lets us look at what the network is actually doing instead of relying on guesswork and popular narratives. Wallet behavior, coin age, exchange inflows and outflows, and the distribution of realized capital each reveal a piece of the bigger picture.
Put these data points together and a more complicated picture of Bitcoin ownership emerges, one that shows market power isn't concentrated in a handful of big whales, and that the ownership structure of Bitcoin is shifting.
Bitcoin Supply Distribution: What Does the On-Chain Data Say?
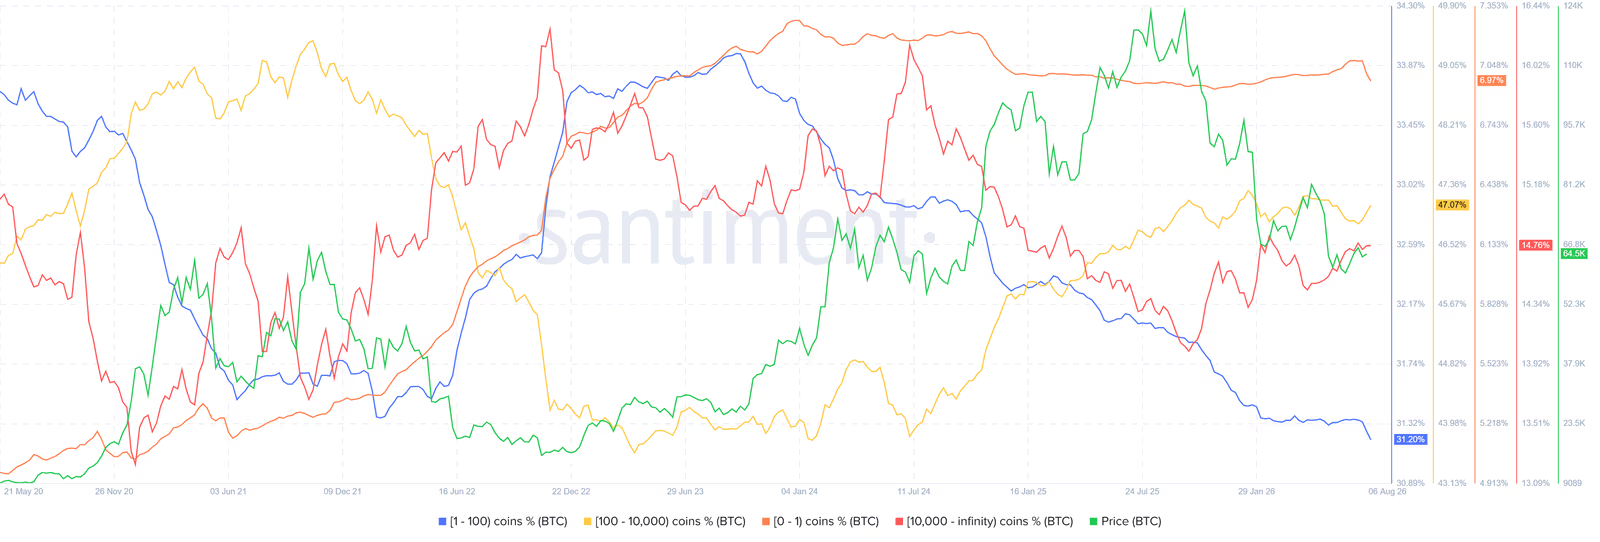
Santiment data from August 2026 breaks Bitcoin supply down into four main groups, based on how much Bitcoin each address holds.
The first group covers addresses holding less than 1 BTC. This group controls about 6.97% of the supply, and its share has been drifting down slowly.
The second group holds between 1 and 100 BTC. It accounts for roughly 31.20% of the supply, its lowest share since 2020.
The third group covers addresses with 100 to 10,000 BTC. It holds 47.07% of the supply and has grown noticeably since 2022.
The fourth group is addresses holding more than 10,000 BTC, referred to here as megawhales. This group holds about 14.76% of the supply, and its behavior tends to be more cyclical.
Combine the first two groups and small addresses together hold roughly 38% of Bitcoin's supply. That's a sign retail investors may control a bigger share of the market than the usual whale narratives suggest.
An Important Limitation in Bitcoin Ownership Analysis
There's an important technical caveat here, one that matters for reading Bitcoin ownership data correctly.
The Santiment data used in this analysis is based on raw addresses, not entity-adjusted data. That means every address is counted separately in its own ownership bucket, and multiple addresses belonging to the same entity aren't necessarily grouped together as one owner.
That makes interpretation matter a lot. Say an entity like BlackRock splits its Bitcoin across several wallets, each holding less than 10,000 BTC. In Santiment's raw data, those addresses land in the 100-10,000 BTC bucket even though they all belong to one large entity.
So when we see the 100-10,000 BTC bucket growing in this analysis, our working assumption is that part of that growth comes from institutional capital or Bitcoin moving into custody wallets, not necessarily from a wave of new independent holders at that size.
That simple distinction carries an important lesson for on-chain analysis: an address's balance isn't the same thing as its real owner.
Raw data is genuinely useful for seeing how Bitcoin is spread across addresses, but pinning down exactly which entity or person owns those coins requires entity analysis and address labeling too.
So for the rest of this article, whenever we mention the growing share of the 100-10,000 BTC group, we're treating it as evidence of a shift in the supply distribution structure, not definitive proof of which entities own those coins.
The Structural Shift of Bitcoin From Retail to Institutions
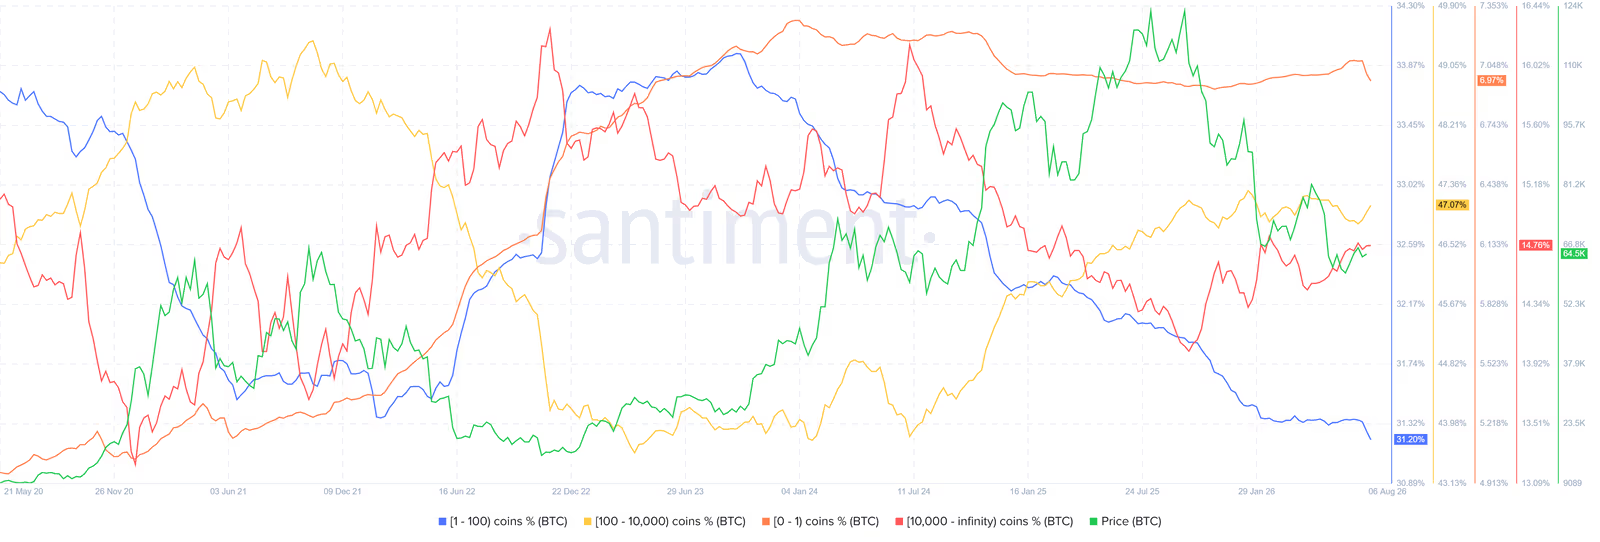
One of the most important trends in Bitcoin ownership data is how two groups are moving in opposite directions at the same time.
The share held by addresses with 1 to 100 BTC has dropped from around 33% in 2021 to 31.2% in August 2026. Meanwhile, the 100-10,000 BTC group's share has jumped from about 24% in 2021 to 47% in August 2026.
This inverse relationship picked up speed starting in January 2024, right around when spot Bitcoin ETFs launched in the US.
A cautious read is that some of the Bitcoin once held directly by retail investors is now sitting with financial institutions, ETFs, and custodians instead.
If this trend keeps going, Bitcoin's market behavior could end up more influenced by macroeconomic conditions, Fed policy, and capital flows in traditional markets, and less tied to the classic four-year cycle pattern.
Miners' Shrinking Influence on the Bitcoin Market
For years, miners were one of the key players in Bitcoin's cycles. Halvings cut mining rewards and squeeze miner economics, and the resulting financial pressure can shape how they behave in the market.
But to see how much miners' role has actually changed today, looking only at how much Bitcoin they hold isn't enough. One useful metric for this is the Miner Supply Ratio.
What Is the Miner Supply Ratio?
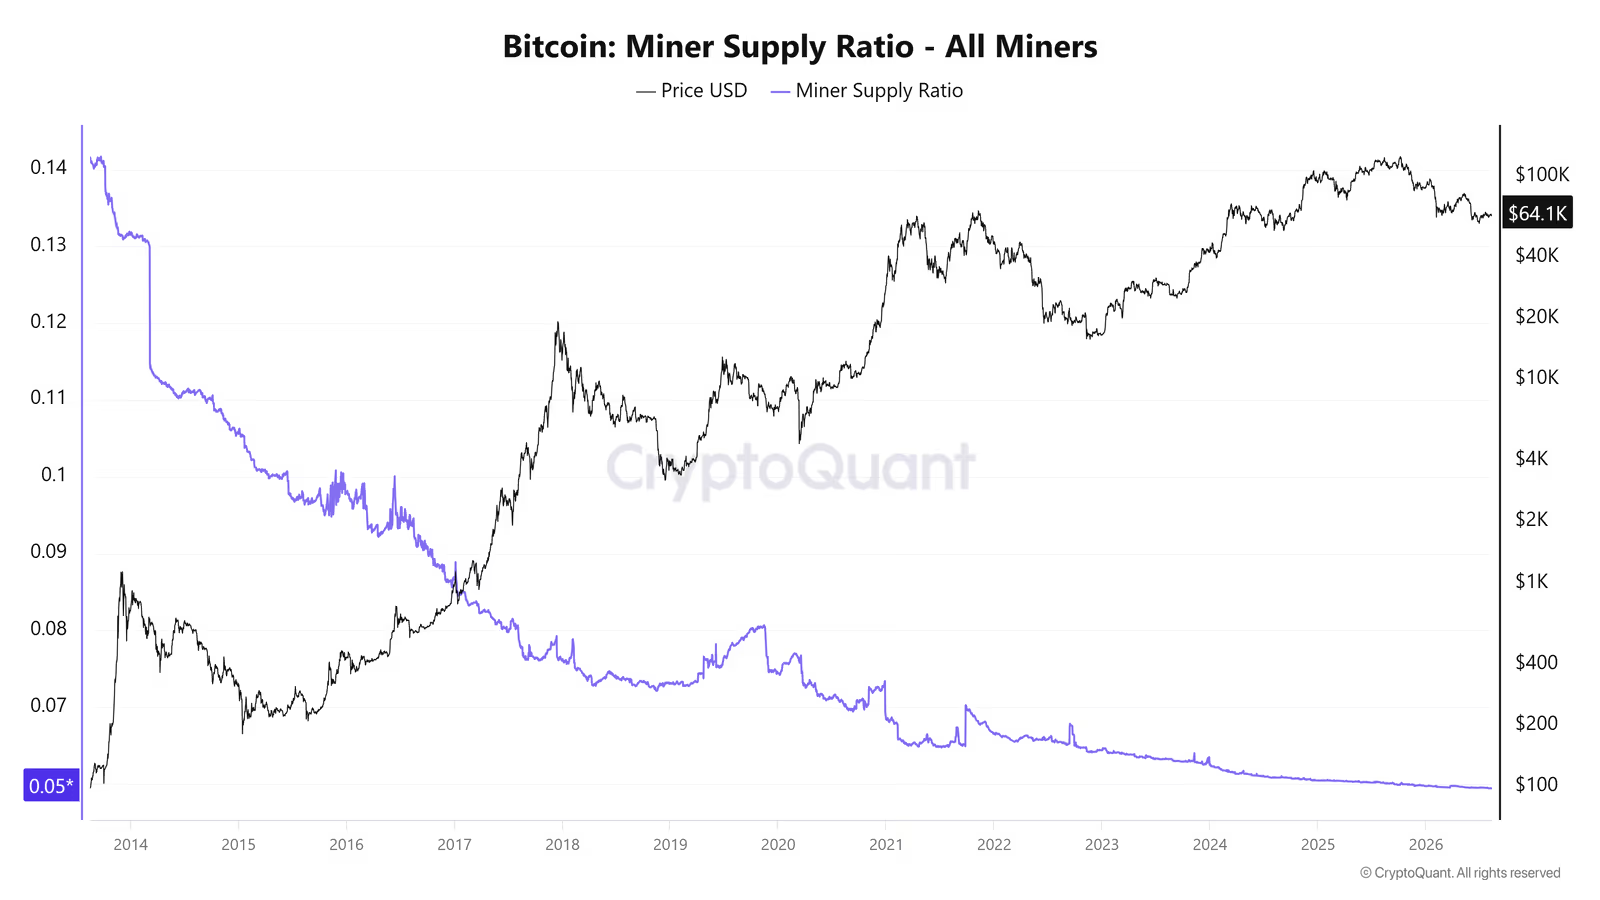
The Miner Supply Ratio shows what portion of Bitcoin's total supply sits in miner wallets.
In simple terms, it tells us how much Bitcoin miners hold relative to the entire network. A falling ratio means miners' share of total supply has shrunk over time.
According to this analysis, miners' share of total Bitcoin supply is now down to about 6%, its lowest level on record. That decline shows miners now carry less weight in Bitcoin's ownership structure than they used to.
The key point is that the Miner Supply Ratio measures miners' share of total supply, not their selling directly. So a falling ratio by itself doesn't mean miners are dumping heavily, it just means their slice of total Bitcoin supply has gotten smaller.
That's why this metric needs to be read alongside flows of Bitcoin from miners to exchanges. In the data behind this article, inflows from miners to exchanges have run slightly ahead of the reverse flow, meaning miners have stayed net sellers overall.
So the more accurate picture is this: miners' share of total supply has fallen, and at the same time, they're still feeding part of their newly mined Bitcoin into the market to cover mining costs.
In short, miners' role in the market structure has weakened compared to past cycles, but that doesn't mean their impact has disappeared entirely. They're still one of the market's supply sources, just with less weight now compared to institutional capital, ETFs, and other big players.
What Do Miner-to-Exchange Flow and Exchange-to-Miner Flow Show?
Two key metrics help track miner behavior.
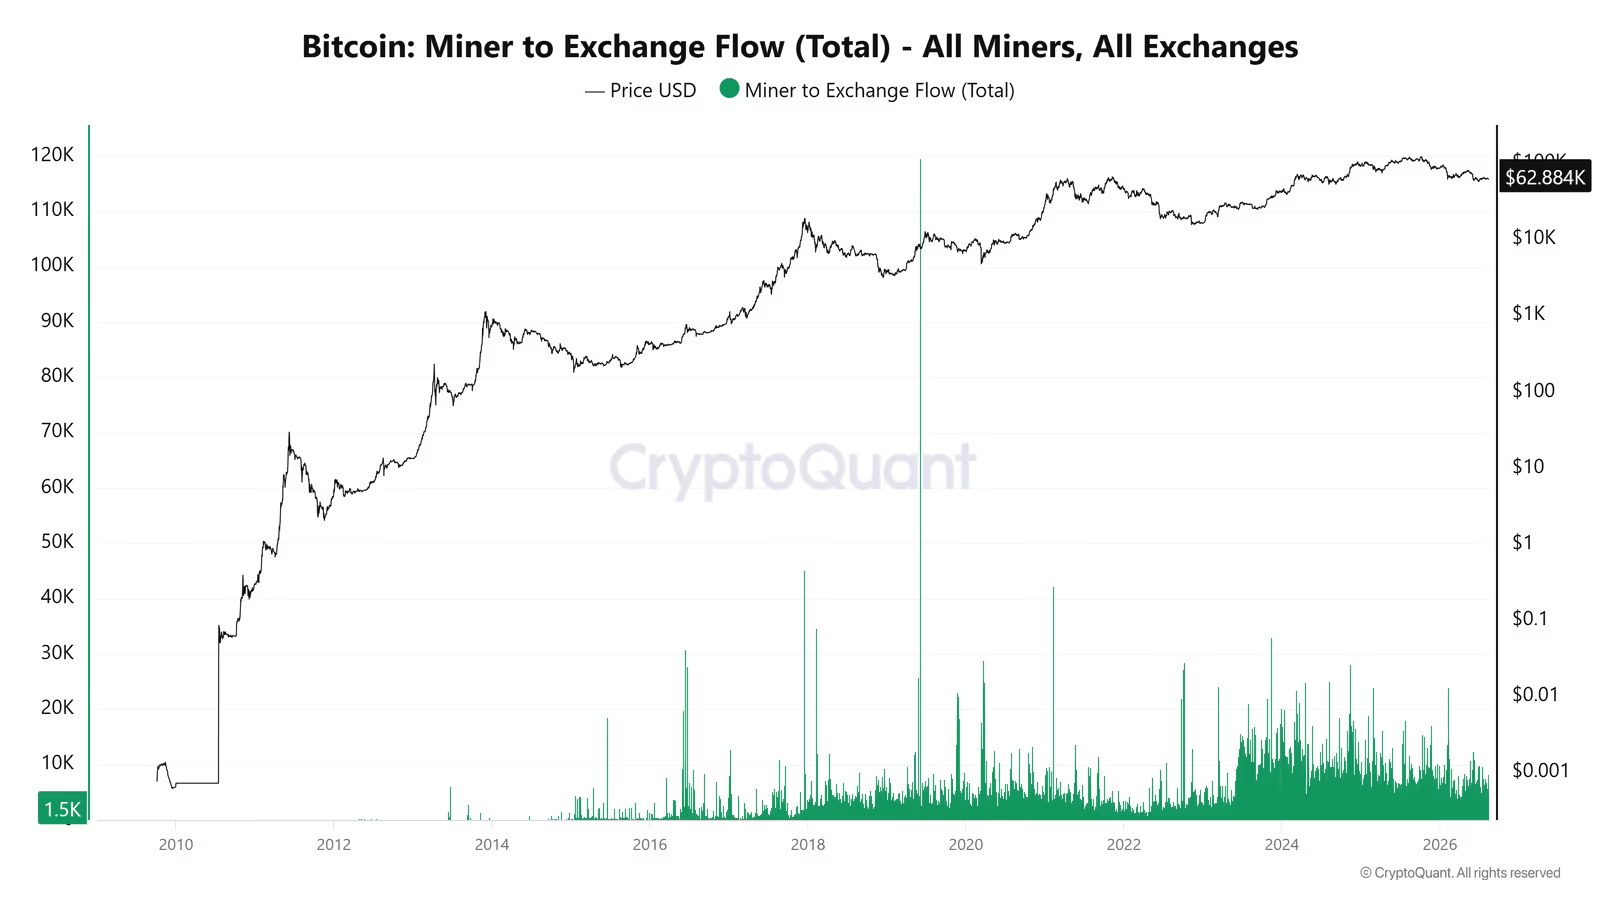
Miner-to-Exchange Flow tracks how much Bitcoin moves from miner wallets to exchanges. A rise in this flow can signal miners becoming more willing to sell or needing liquidity.
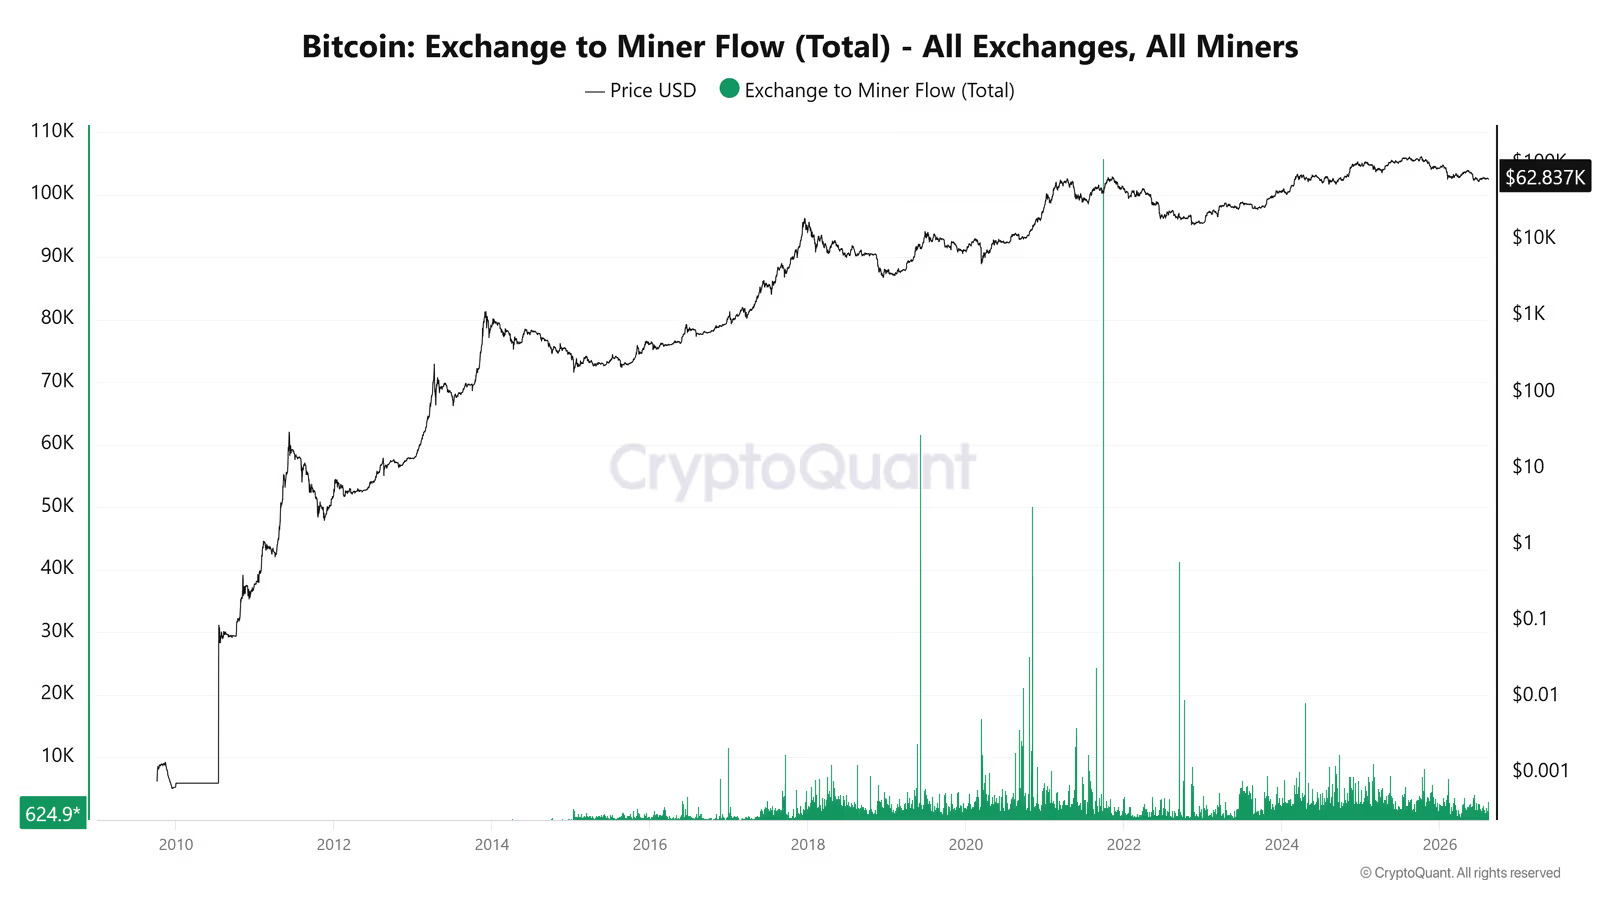
Exchange-to-Miner Flow works the other way, tracking Bitcoin moving from exchanges back to miner wallets. This can happen for several reasons: buying back in, operational transfers, or simply moving funds between wallets the miner already controls.
Since early 2023, both flows have picked up noticeably. Still, inflows from miners to exchanges have stayed slightly ahead of the outflows, so miners have remained net sellers overall, though the selling pressure is milder than a single chart might suggest on its own.
One likely driver of that selling pressure is rising mining costs. Electricity, hardware, and higher network difficulty have pushed miners to cash out part of their newly mined Bitcoin just to cover operating expenses.
None of this means Bitcoin's four-year cycle has vanished completely. The point is that the market's main drivers are shifting, and institutional capital flows, global liquidity, and macro conditions may now play a bigger role than before.
Bitcoin ETFs and the $85,000 Price Level
One of the most important new players in the Bitcoin market is US spot ETFs.
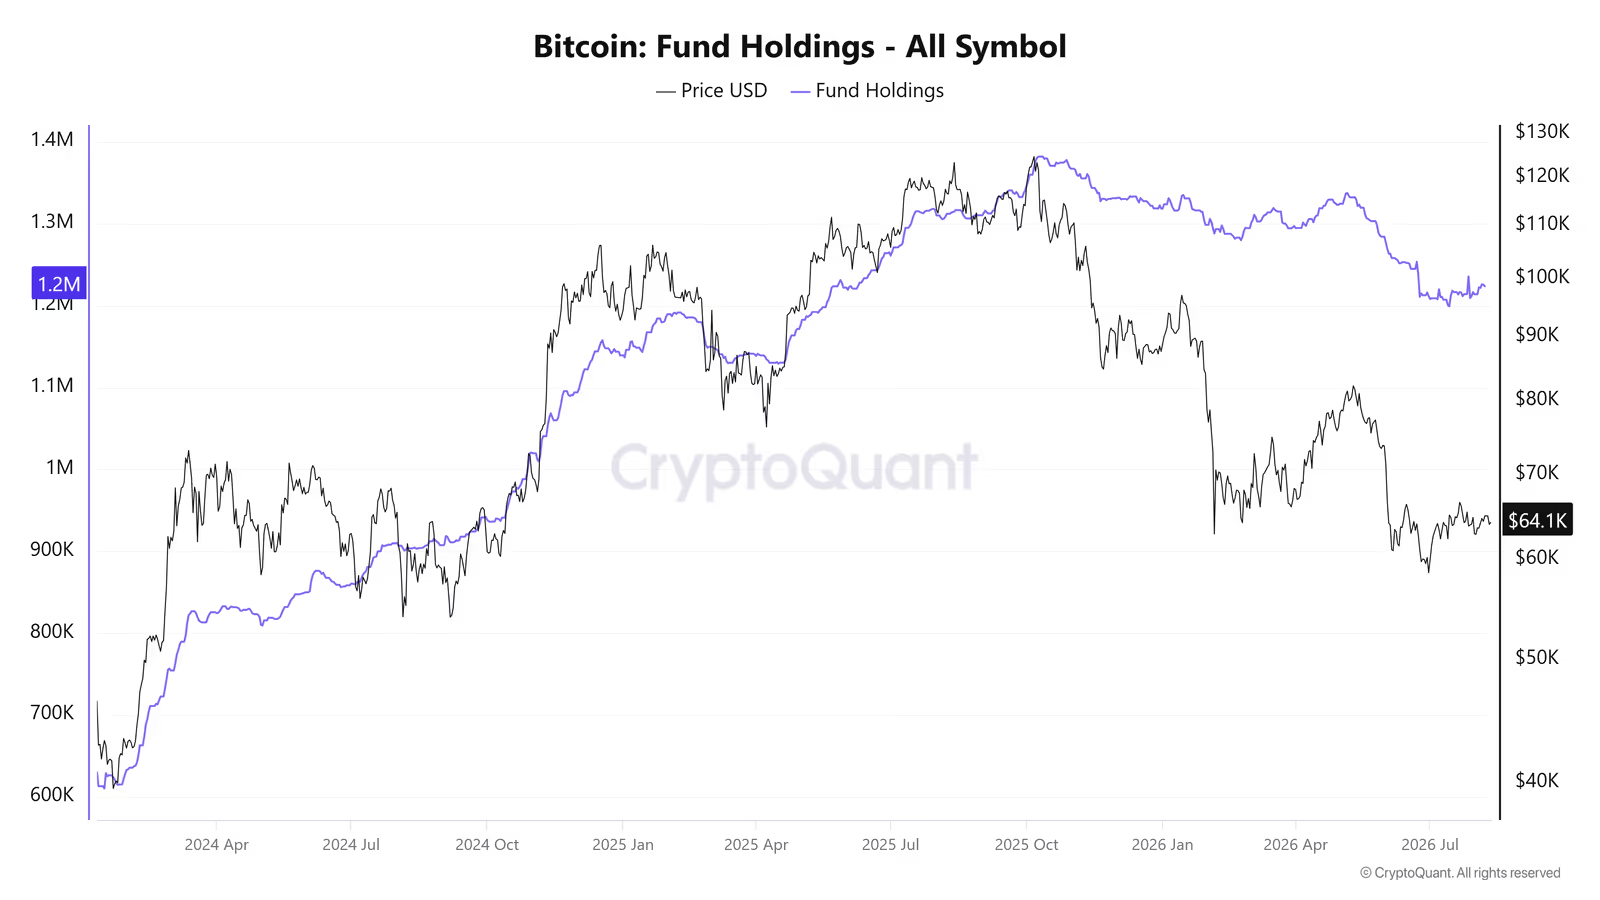
These funds started operating in January 2024 and have since pulled in more than 1.2 million BTC, equal to roughly 6% of Bitcoin's circulating supply.
The arrival of ETFs marked a real shift in market structure, since traditional investors can now get exposure to Bitcoin through their brokerage accounts without holding the asset directly.
What Is the ETF Cost Basis?
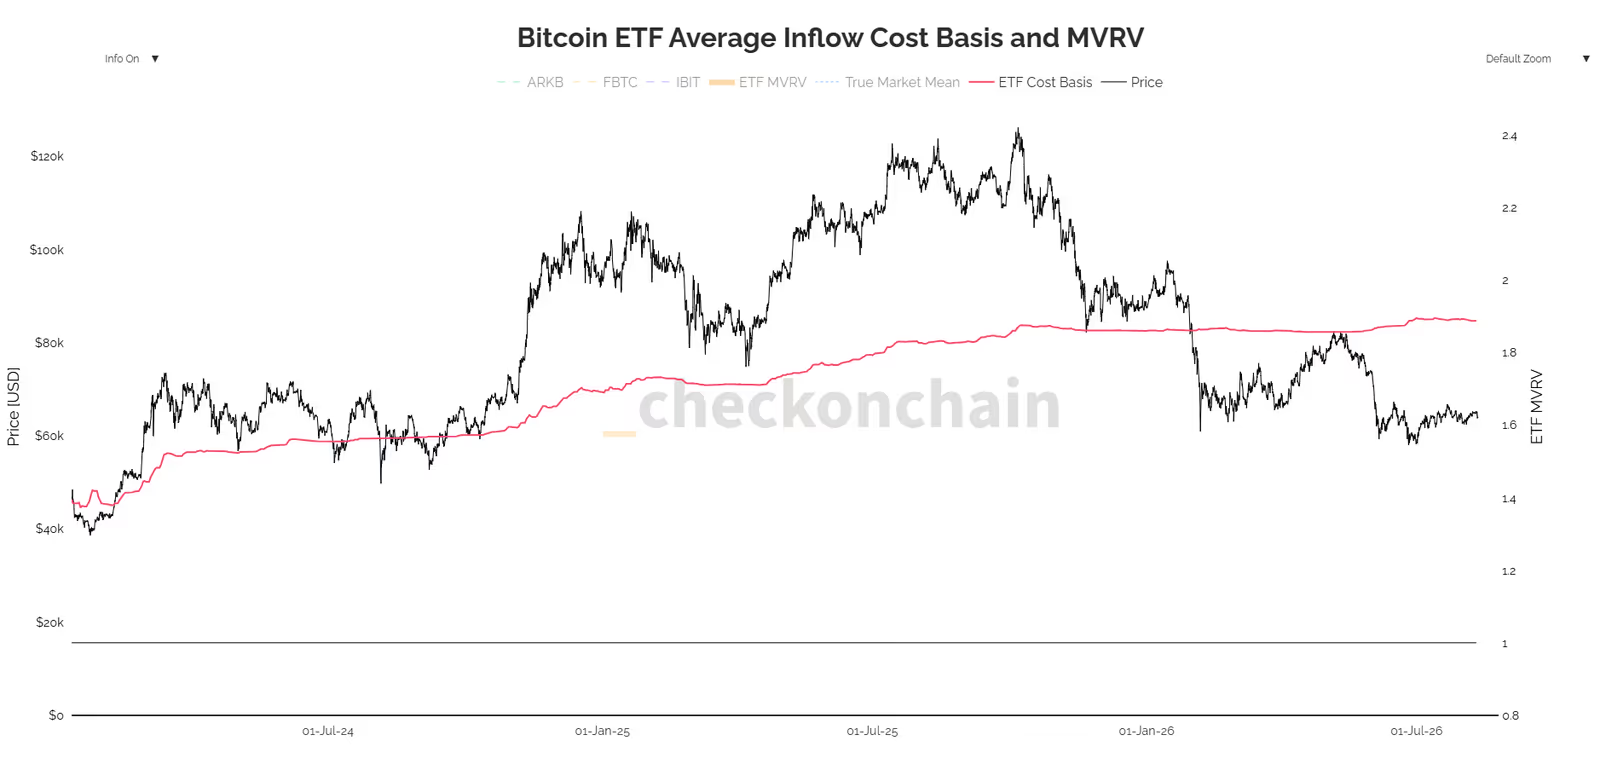
Cost basis refers to the average price a group paid to buy its Bitcoin.
According to the data used here, the aggregate cost basis for Bitcoin ETFs sits between $84,700 and $85,000.
As the market price approaches this level, it can carry real psychological and trading weight. If some investors hit breakeven in this range, they may decide to sell just to exit without a gain or loss.
That said, an average purchase price alone can't create a definitive resistance level. ETF investors didn't all buy at one price. Some got in much lower, others much higher.
A closer look requires examining the actual distribution of purchase prices across coins.
What Is URPD and Why Does It Matter?
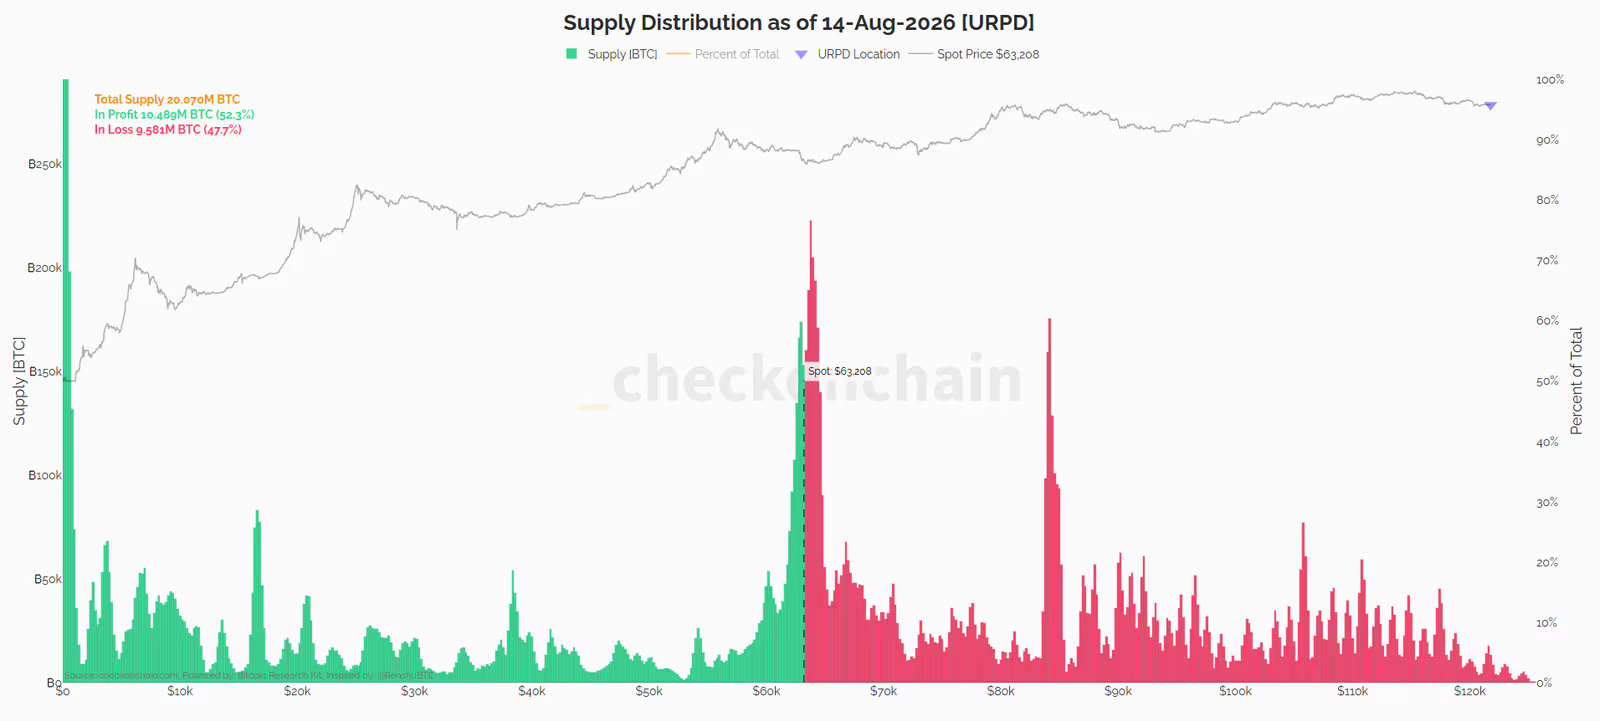
URPD, short for UTXO Realized Price Distribution, shows how existing Bitcoin is spread out based on the price each coin last moved at.
Put simply, URPD tells us how much of the Bitcoin supply last moved within each price range.
Based on the URPD chart from August 14, 2026, four price ranges stand out:
Around $63,000, a large chunk of supply sits here. This range is close to the current price and looks more like an accumulation zone still forming, not a support or resistance level for now.
Around $65,000, there's a smaller peak that could come with some selling pressure.
The $84,000-$85,000 range shows a bigger peak, one that overlaps with the ETFs' average buy price.
Finally, the $105,000 range stands out as the next structural resistance on the way up.
The $84,000-$85,000 range doesn't matter just because of the ETFs' average buy price. URPD data shows a meaningful chunk of supply sitting in this same range too.
Two independent data sets are pointing to roughly the same range: the ETFs' cost basis around $85,000, and the URPD supply cluster between $84,000 and $85,000.
That overlap could make this range more significant if price gets there. Holders who bought in this same range may sell to exit at breakeven, and the same could happen with a portion of ETF holders.
That doesn't guarantee a hard resistance level, though. The on-chain data simply shows this range carries more weight in terms of supply distribution and cost basis.
Strategy: Is the Biggest Corporate Bitcoin Holder Selling Too?
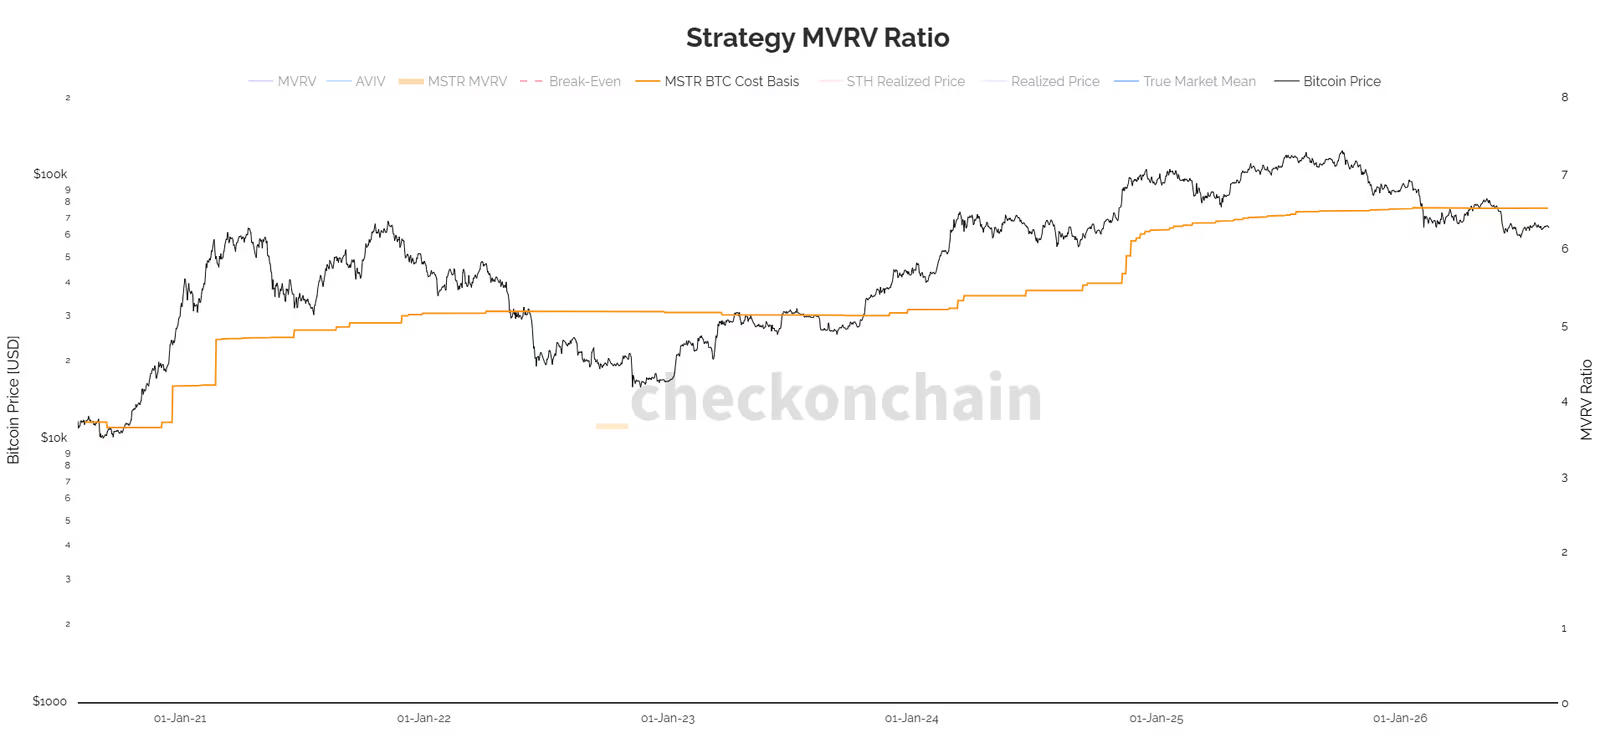
Strategy is one of the biggest corporate Bitcoin holders out there, controlling more than 4% of total supply according to the data used here. The company's average buy price comes in at around $75,000.
For years, the company's strategy centered on building up and holding its Bitcoin position. But the data shows a handful of sales recorded in 2026:
In early June 2026, about 32 BTC were sold at roughly $71,300.
In early July 2026, about 3,588 BTC were sold at roughly $64,000.
In early August 2026, about 1,637 BTC were sold at roughly $63,500.
These sales aren't huge relative to the overall Bitcoin market, but they matter when it comes to reading institutional behavior.
They show that even a large holder that has emphasized holding Bitcoin for a long time can turn into a seller under certain financial pressures.
The bigger concern is about other companies running the same Bitcoin treasury model. If the price stays below the $75,000 range for a long stretch, companies with weaker balance sheets could face more pressure to sell.
Supply in Profit: How Much Bitcoin Is Sitting in Profit?
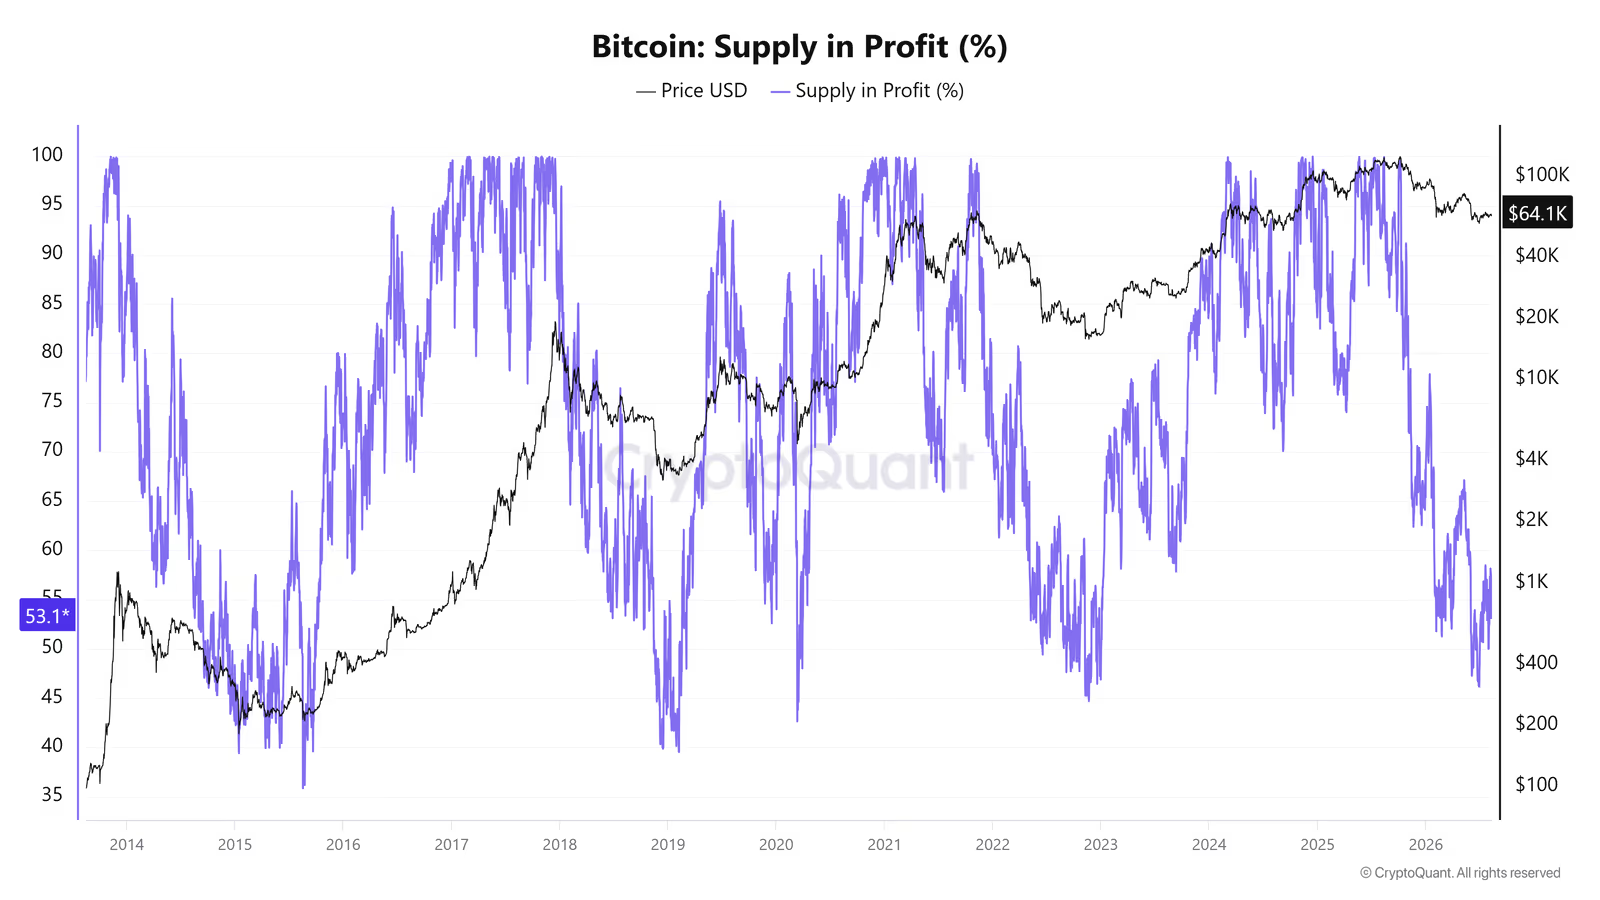
Supply in Profit measures what percentage of Bitcoin's supply is sitting above its realized price, meaning it's currently in profit.
According to CryptoQuant data, this metric has fallen to around 55%. That means roughly 45% of existing Bitcoin has a cost basis above the current price and sits in unrealized loss.
This becomes more meaningful once we break down how different groups of holders are behaving.
6-to-12-Month Holders: Heavy Capital Sitting at a Loss
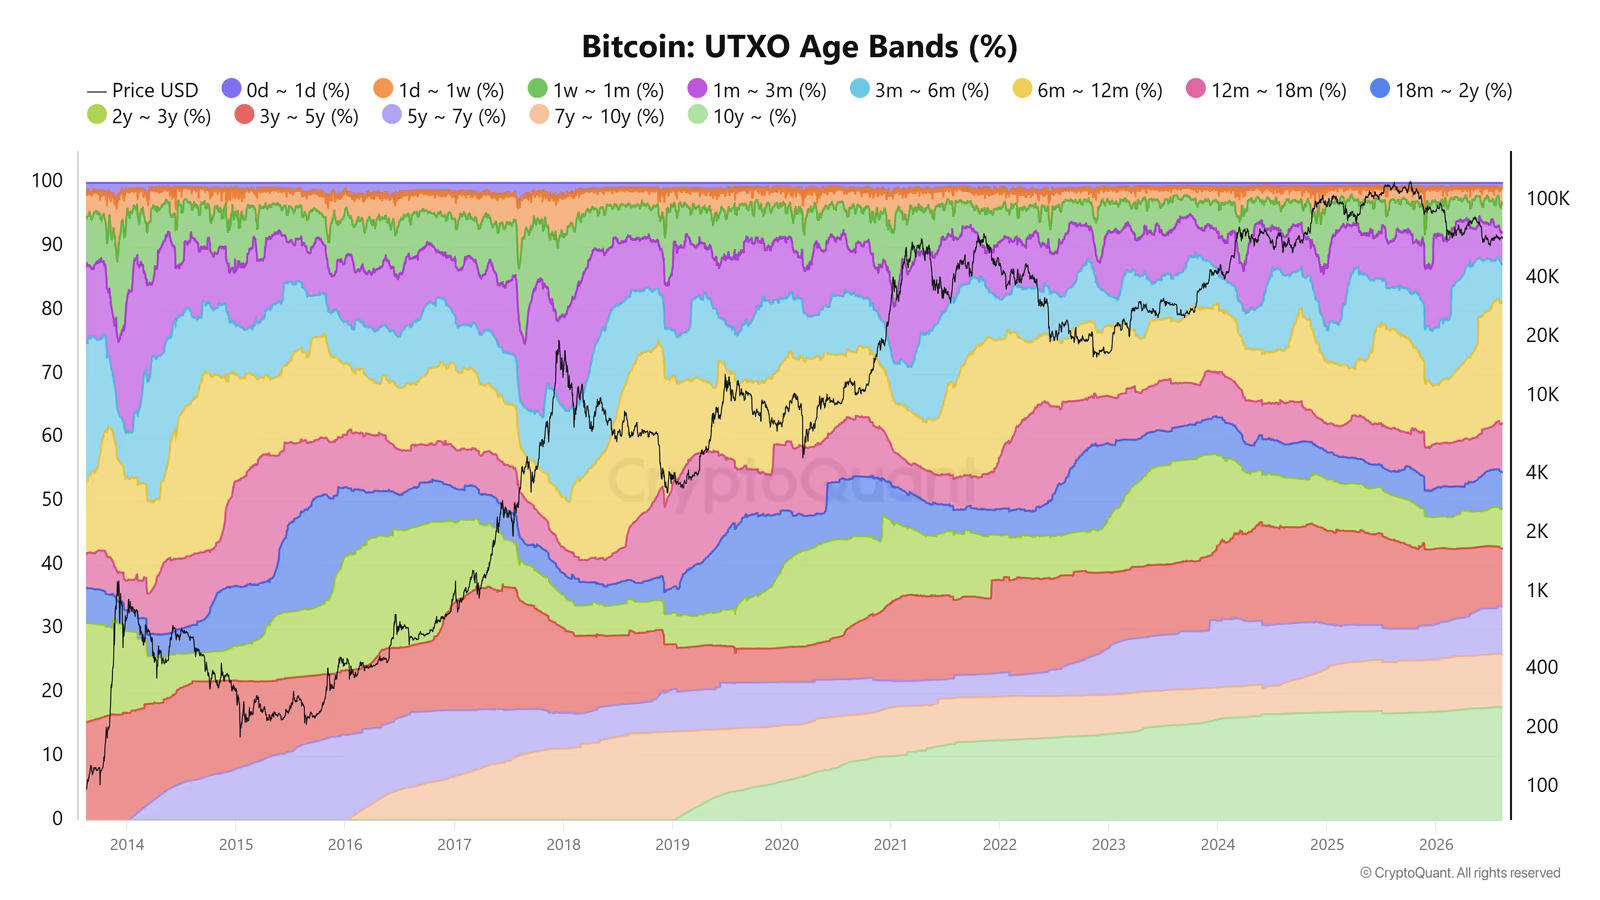
Holders who've kept their Bitcoin for 6 to 12 months control about 18.99% of the network's total supply.
But this group's significance goes beyond how much Bitcoin they hold.
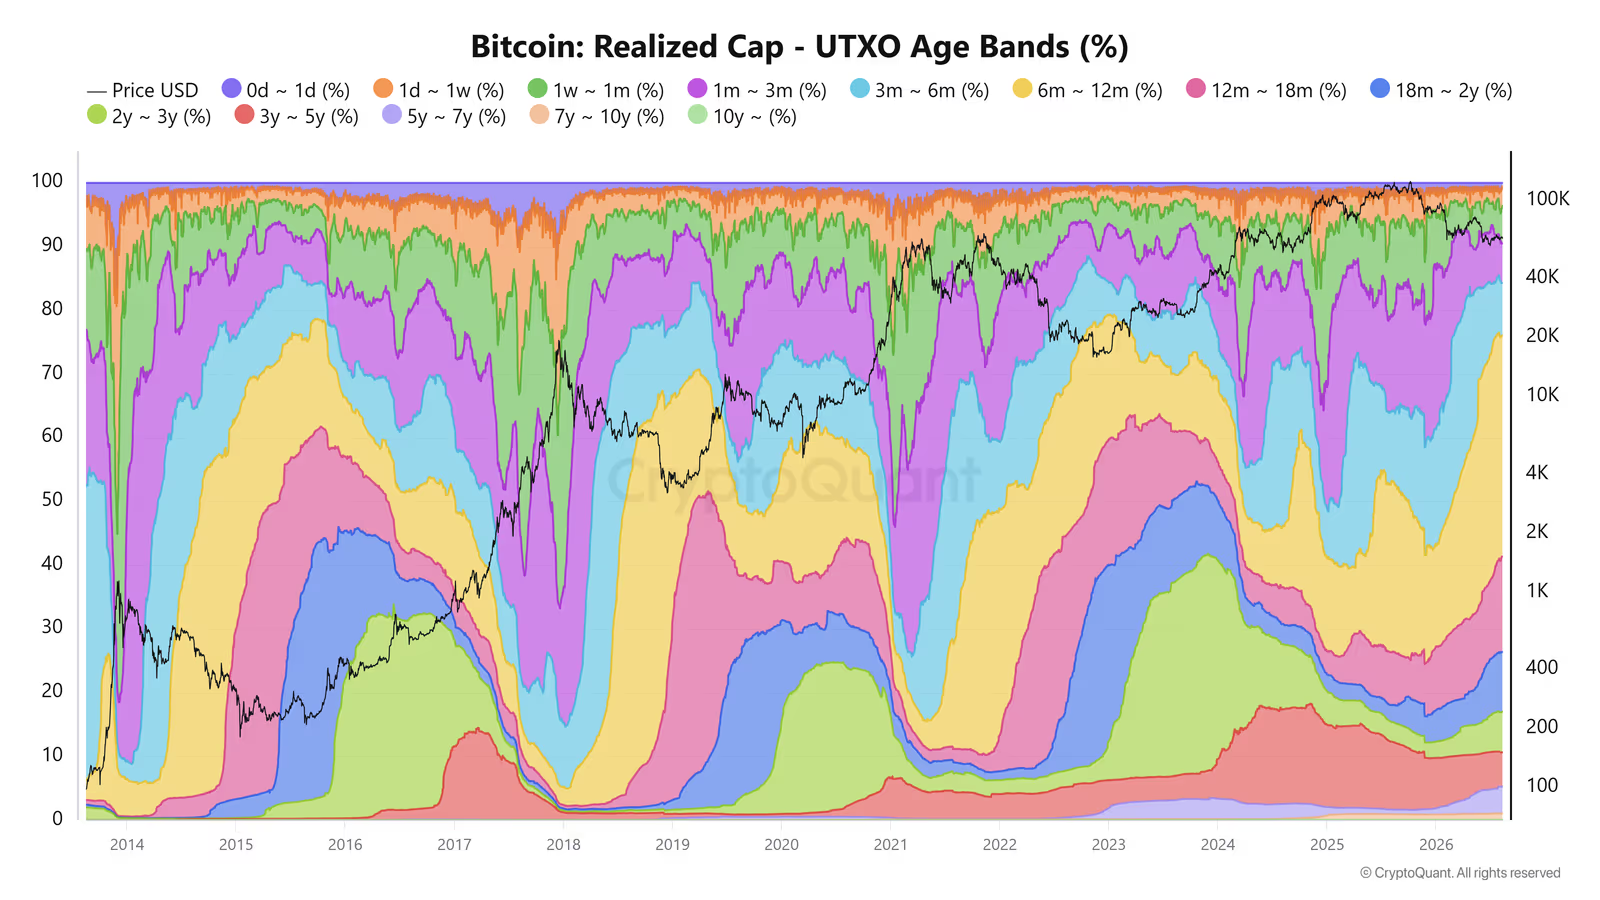
By Realized Cap, this group accounts for around 35.11% of all the dollar capital that has entered the network.
Unlike Market Cap, Realized Cap values each coin based on the price it last moved at, which makes it useful for tracking where capital has actually entered the network.
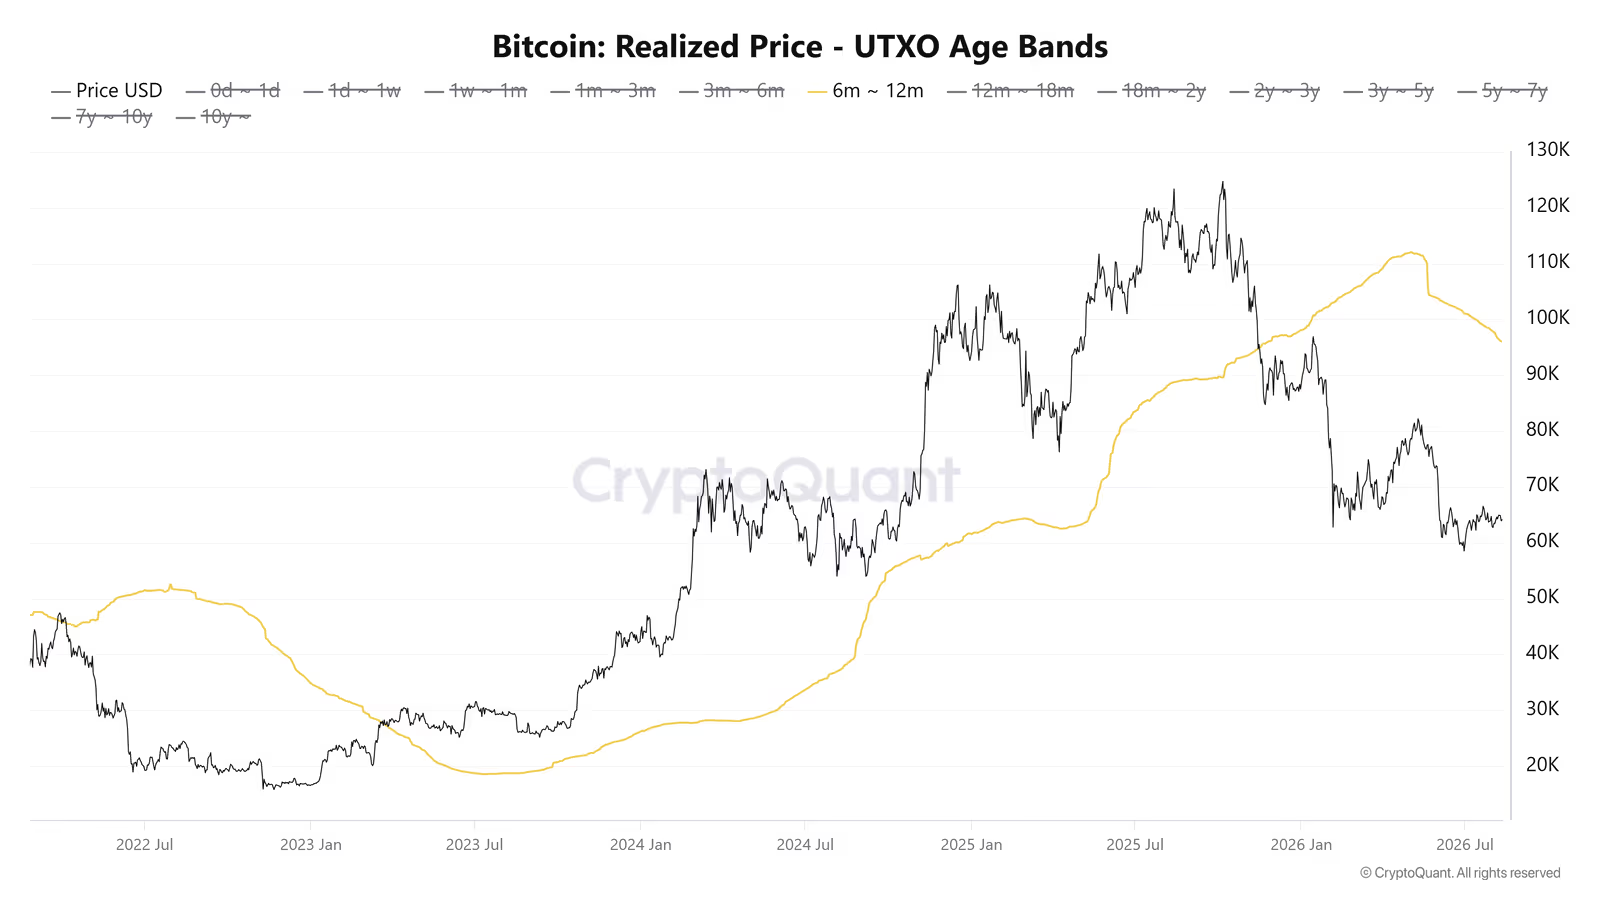
This group's realized price sits at around $96,632. Against the $64,000 price point used in this analysis, that puts these holders more than 33% underwater on average.
But here's the key point: despite that significant loss, there's no sign of heavy selling from this group.
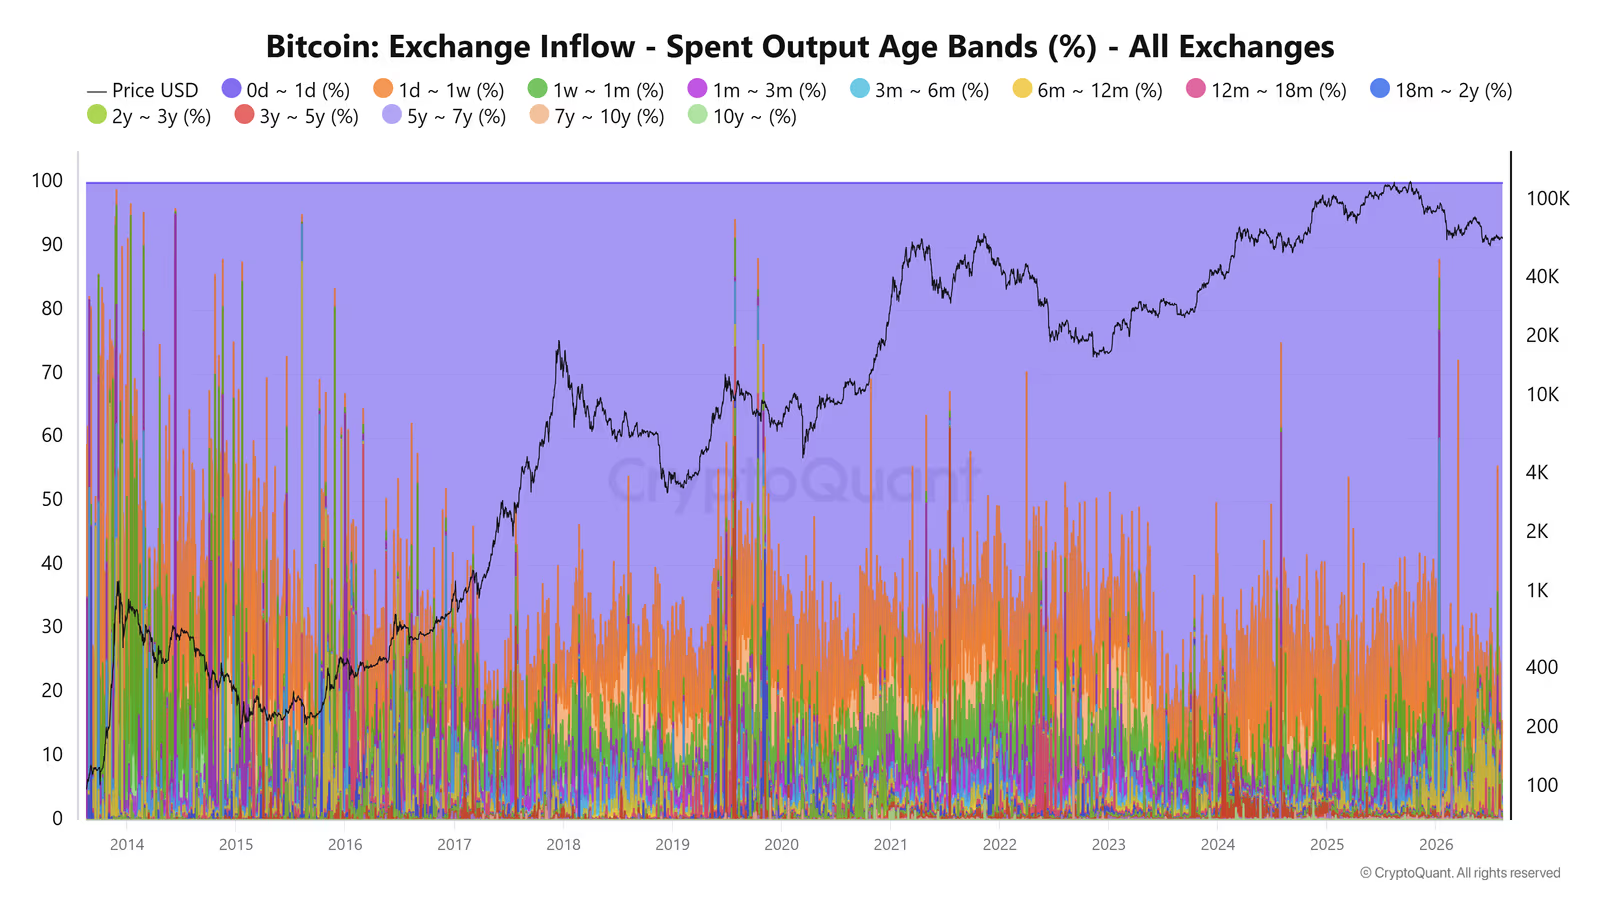
Their share of exchange inflows is only about 1.53%, which suggests most of these investors are still holding onto their Bitcoin for now.
That could change, though. If price stays low for an extended period, psychological and financial pressure can build up, raising the odds of capitulation.
Capitulation refers to the stage where investors sell to exit the market because losses have become too severe or dragged on too long.
Holders Under One Week: A Big Chunk of Daily Market Activity
One important thing on-chain data shows is that a large share of network activity comes from very young coins.
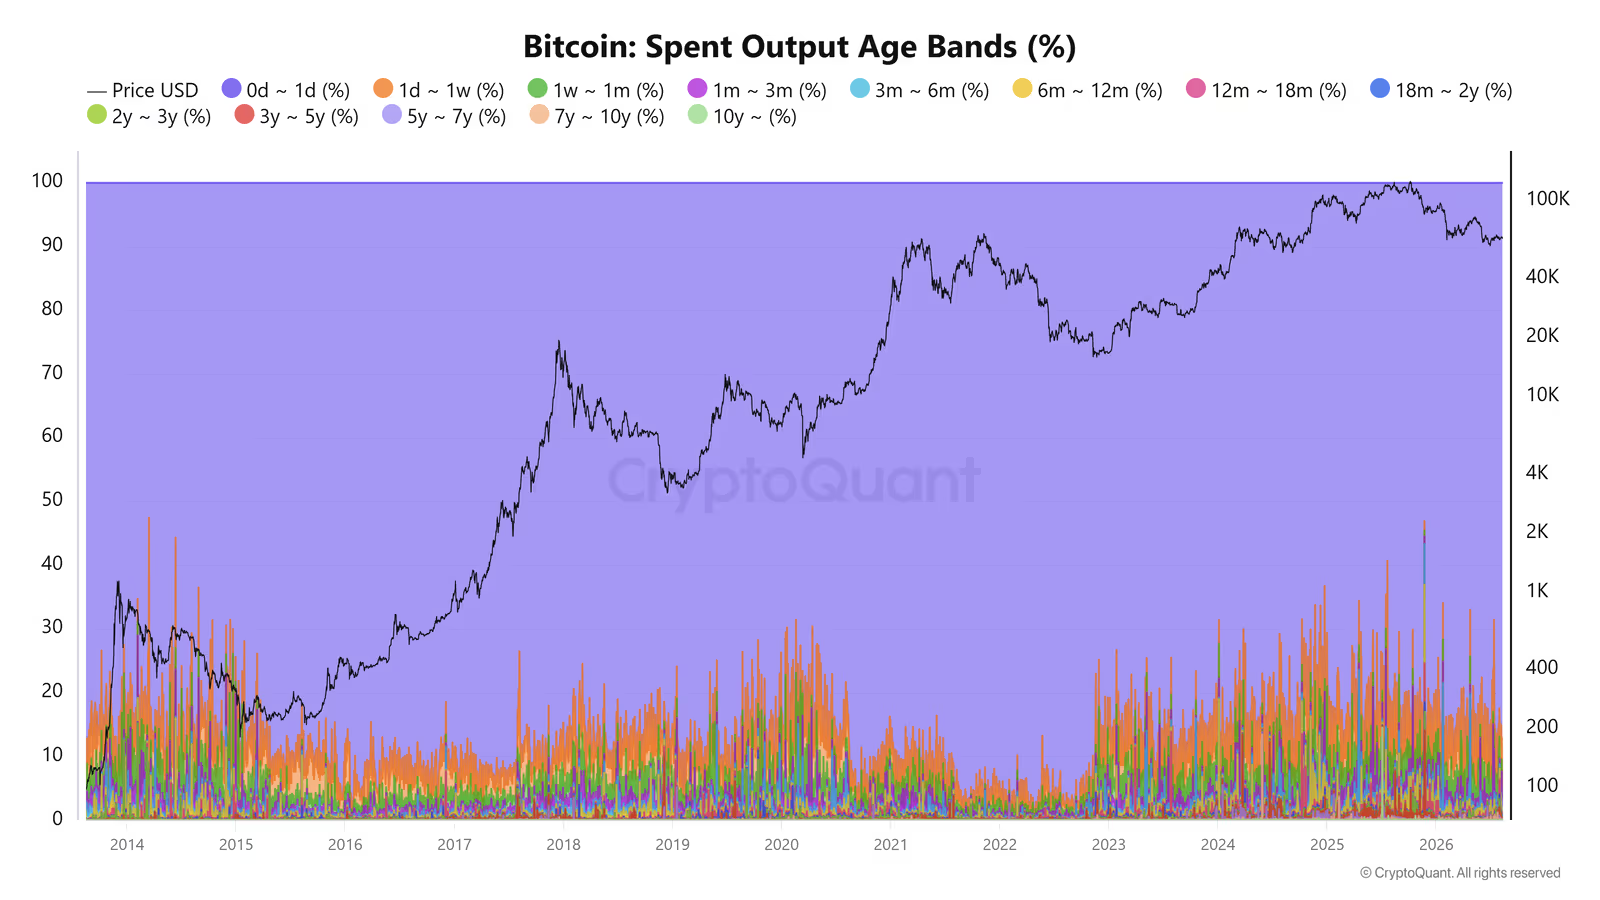
According to CryptoQuant, more than 90% of daily on-chain transaction volume involves coins younger than a week, and 85% of that volume comes from coins less than a day old.
That tells us a large chunk of daily network activity isn't necessarily about long-term capital moving around or big holders selling.
Some of it likely comes from short-term traders, arbitrage bots, and quick transfers between accounts.
Bitcoin Older Than 10 Years: Supply That's Gone Nearly Silent
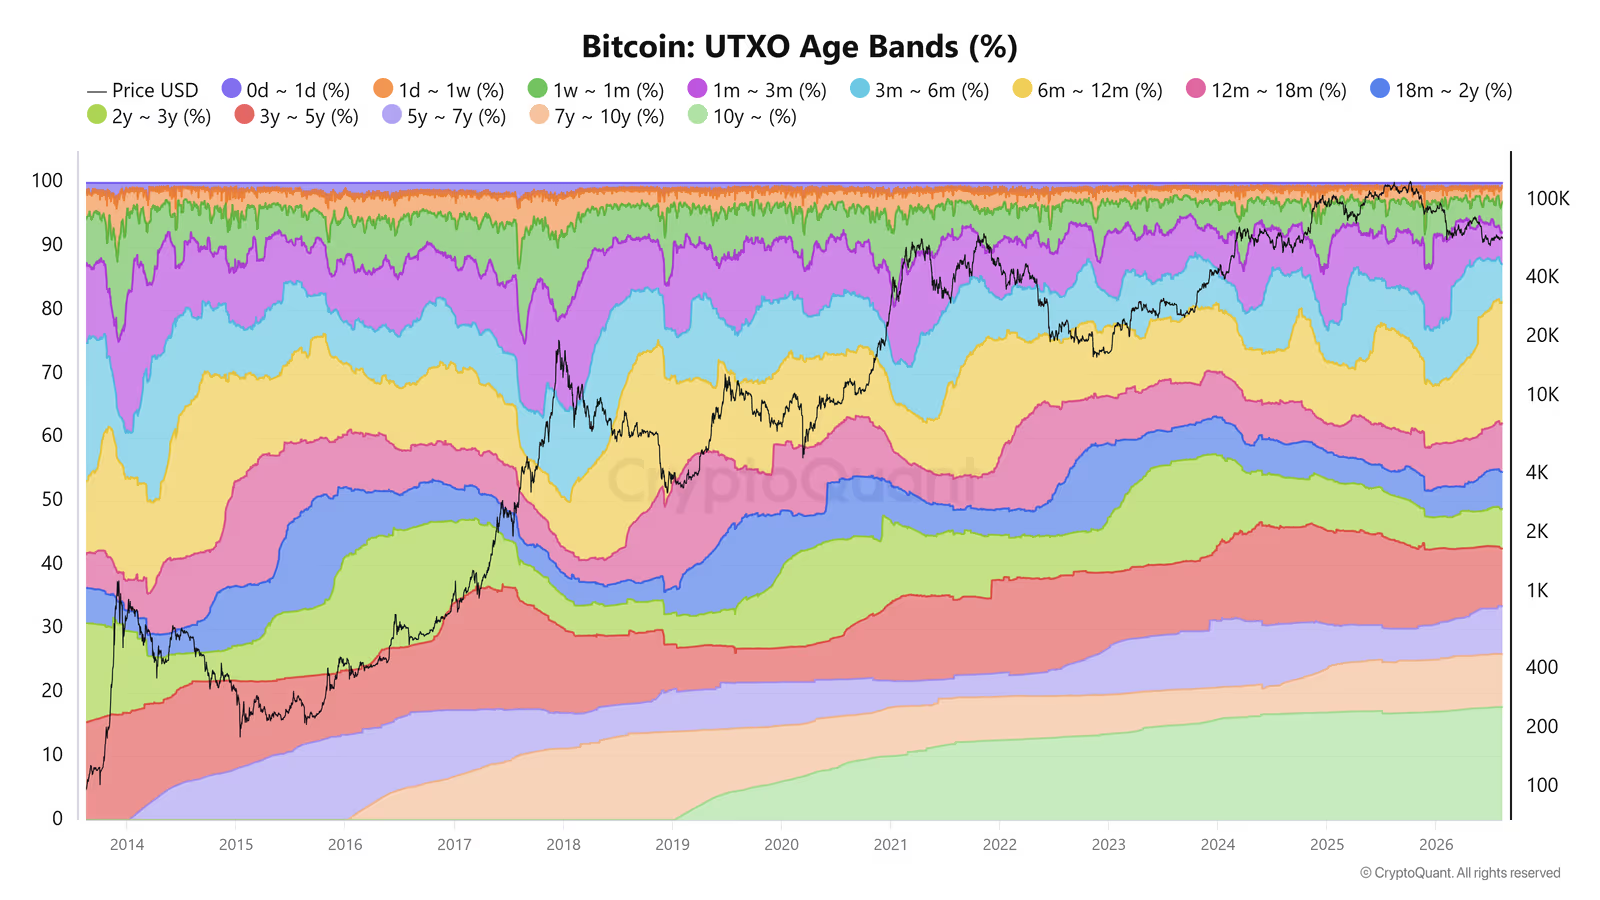
About 17.74% of Bitcoin's total supply is made up of coins that haven't moved in more than a decade.
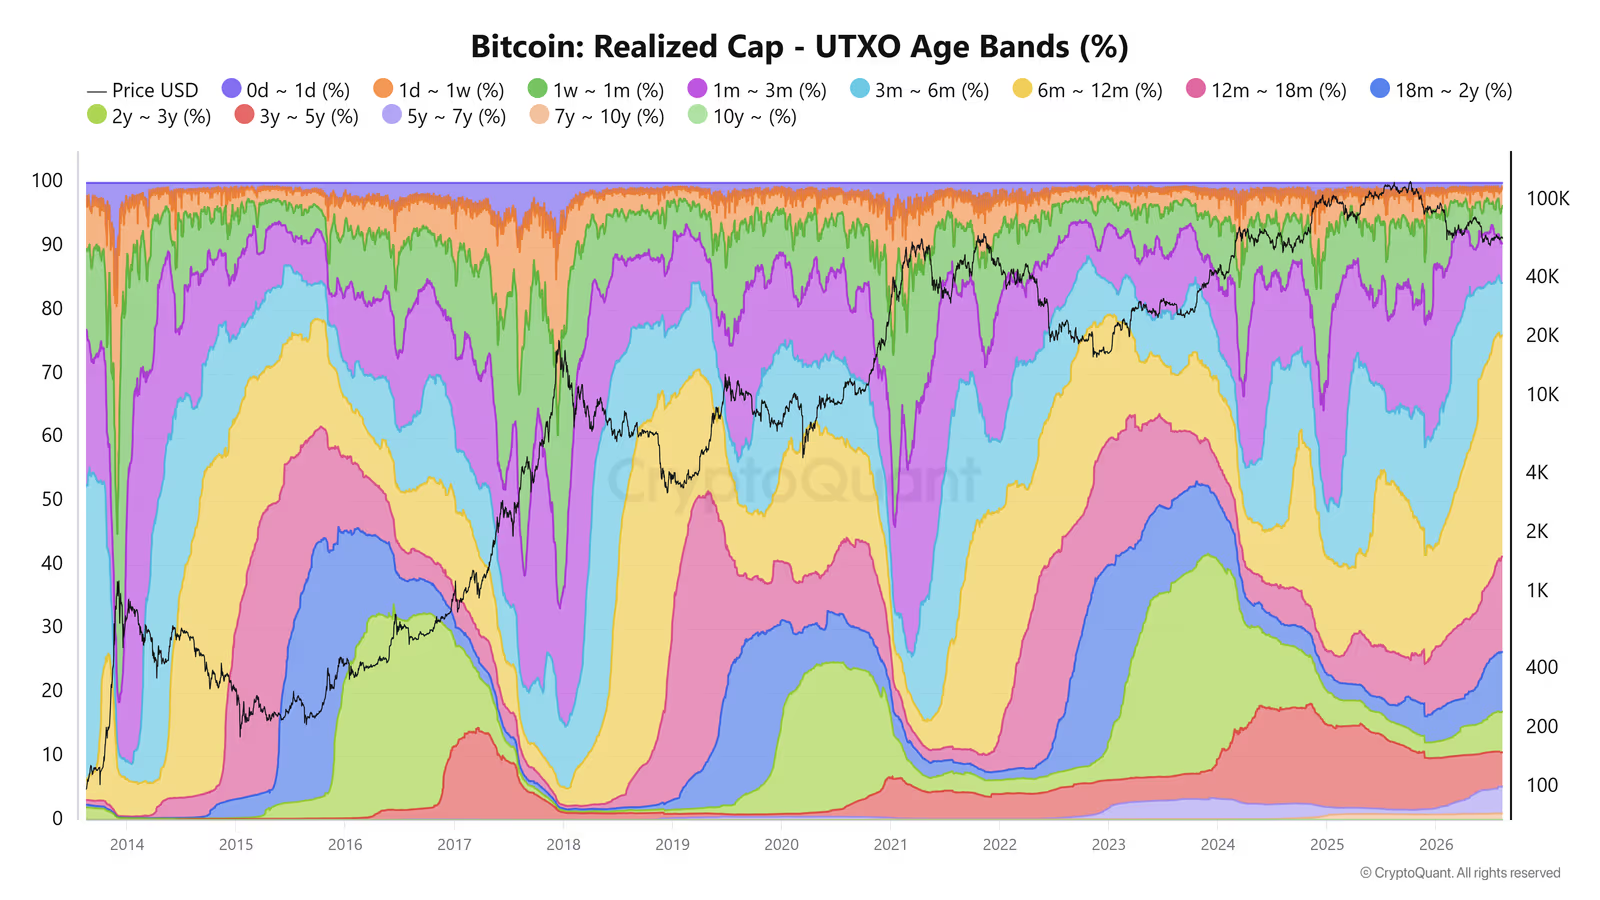
Yet this group's share of Realized Cap is just 0.04%. The gap comes down to how cheap these coins were when they last moved, around $118 according to the data here.
You could think of this group as anchor supply for the network, coins that have mostly sat still for years. That said, any sudden movement from this group can trigger a strong psychological reaction in the market.
Traders might read the movement of very old coins as a sign that their owner knows something about the market. That kind of assumption can spark extra fear and trigger selling.
So, Who Really Owns Bitcoin?
Put all the on-chain data together and a different picture emerges than the simple "whales are selling" story.
Megawhales are in accumulation mode, and 6-to-12-month holders, despite sitting on heavy losses, make up only a small share of exchange inflows.
Second, retail holders' share, especially in the 1-100 BTC bracket, has declined. At the same time, the 100-10,000 BTC group's share has grown.
This could point to a structural shift in Bitcoin ownership, where some supply has moved from direct retail holders to institutions, ETFs, and custody structures. Address-based data alone, though, can't always pin down the final owner behind a set of wallets.
Miners' role is changing too. Their share of total supply has dropped, while flow data shows they're still feeding part of their newly mined Bitcoin into the market.
On the institutional side, ETFs and companies like Strategy have grown more important. The ETFs' cost basis and the URPD supply cluster have turned the $84,000-$85,000 range into one of this cycle's key levels, even as a sizable group of 6-to-12-month holders remain deep in the red.
So it's fair to say Bitcoin is no longer a market you can explain just by watching a handful of big whales. Ownership structure, institutional capital flows, miner behavior, coin age, investor cost basis, and exchange in/outflows all play a part in shaping the market.
That's why analyzing the Bitcoin market shouldn't stop at asking "what are the whales doing?"
The more important question is this:
Which groups are holding, accumulating, or selling, and at what price ranges did their capital enter the network?
That's exactly where on-chain data can offer a clearer picture of what's really happening behind the scenes of the Bitcoin market.