
Every time the Bitcoin price drops, one question is on everyone's mind: where is the Bitcoin bottom? No indicator gives a definite answer to this question. But thanks to the transparency of the Bitcoin blockchain, we can actually observe the real behavior of buyers, sellers, and miners on-chain.
In this article we go through 9 practical on-chain indicators. For each one we cover the exact formula, how to read it, and, more importantly, where the indicator has been wrong or where its limits are. The goal here is not to say "buy right now." The goal is to help you learn to read these tools yourself.
The article is organized into three sections:
Price-based (valuation) indicators Holder behavior and supply distribution Mining economics (production cost and financial pressure on miners)
Part One: Price-Based Indicators
Bitcoin MVRV
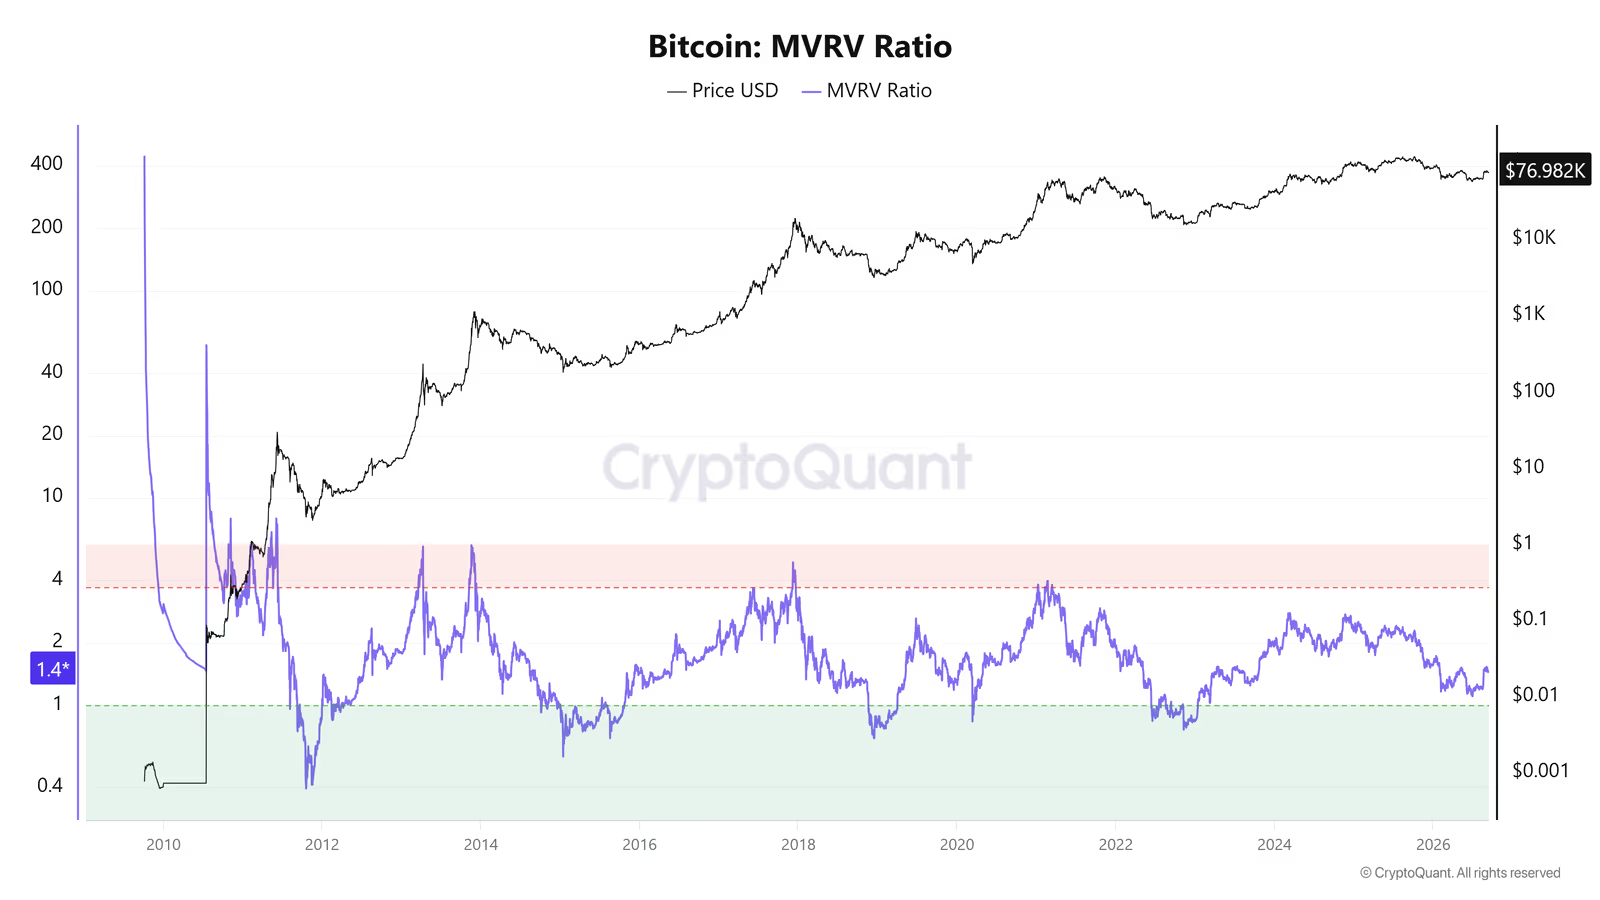
MVRV is one of the oldest and best-known on-chain indicators. The idea behind it is simple: it compares the current market price with the average price at which people actually bought their bitcoin (the "Realized Price").
Or in simpler terms:
When MVRV drops below 1, it means that, on average, the entire market is at a loss. Historically, this zone has usually been attractive for long-term buying. But "attractive" does not mean "the definite bottom."
Looking back at history:
Date | Price at that moment | Did MVRV reach 1? | Where was the actual bottom? | Extra drop after reaching 1 |
|---|---|---|---|---|
September 2011 | $6.53 | Yes | About $2 | About -59% |
October 2014 | $359 | Yes | $182 | About -49% |
November 2018 | $4,840 | Yes | $3,210 | About -34% |
June 2022 | $22,440 | Yes | $15,500 | About -31% |
Important note: in all four previous cycles, MVRV reaching 1 was not the end of the decline; the market usually went somewhat lower afterward. In the downtrend that is still ongoing as this article is being written (2026), the indicator has not yet reached 1.
Important note: this cycle is different from previous ones, because spot Bitcoin ETFs now make up a large share of demand. This means many people are waiting for the price to reach the MVRV = 1 zone (currently estimated around $52,000 to $53,000) and are likely to buy earlier, as soon as the price approaches that zone, so they don't miss out. This kind of collective behavior could even prevent the market from ever going below 1. Still, this is only a possibility, not a rule. A bad piece of economic news could still push the market back into the old pattern.
Summary: MVRV alone does not point to the exact bottom, but it does tell you whether the current price is reasonable for dollar-cost averaging or not.
Realized Price Quantile Bands
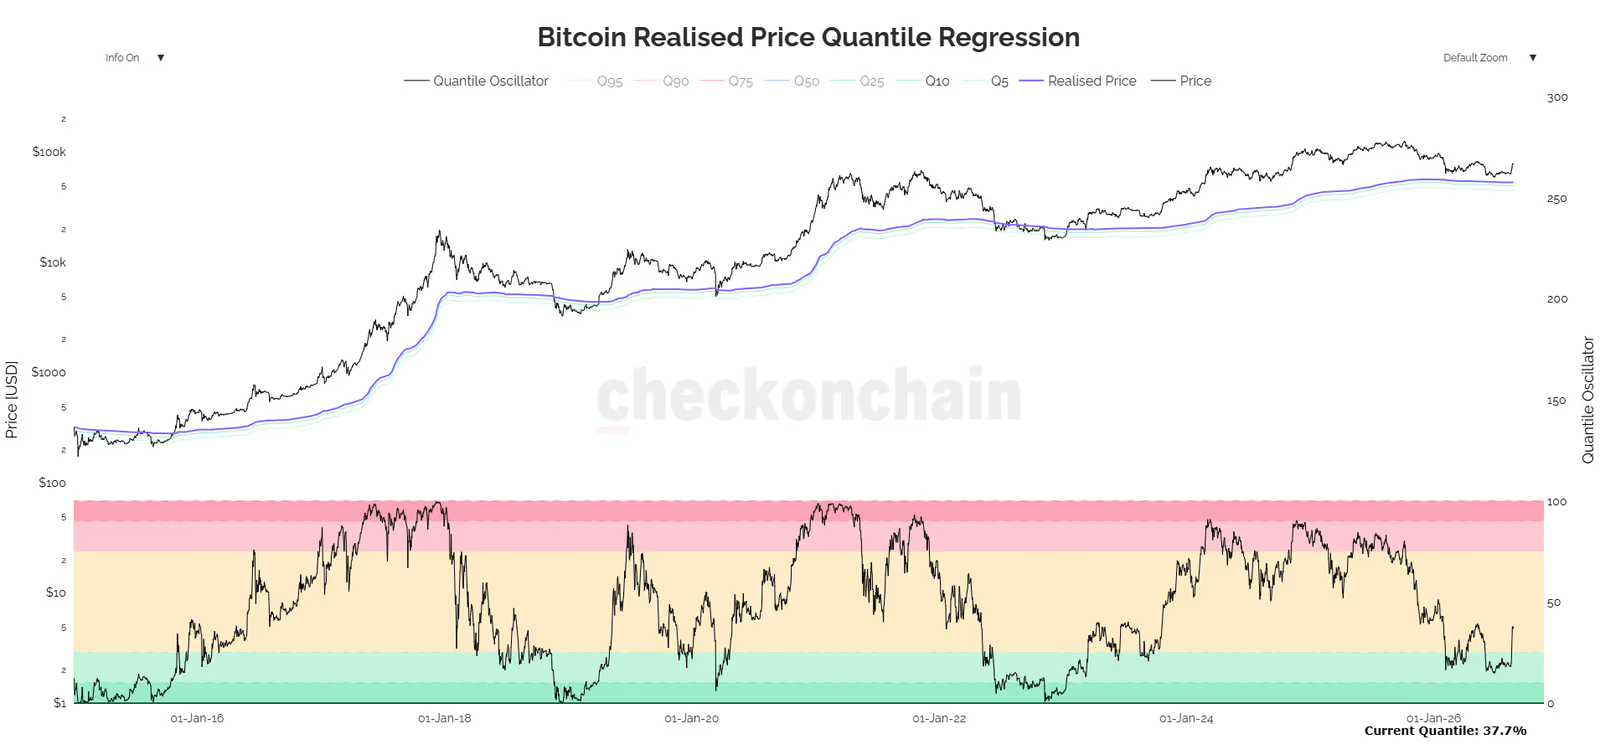
MVRV and Realized Price are closely related, since one is derived from the other (when the market price equals the Realized Price, MVRV is exactly 1). But since reaching that point does not always mean the bottom, statistical methods can be used to break the distance between price and Realized Price into different quantiles, giving a more precise range.
To understand what a quantile actually is, we first measure the ratio of price to Realized Price for every single day in Bitcoin's history and sort these numbers from smallest to largest. If we then split this list into 100 equal parts, each part is a quantile.
Q5 = the ratio level below which only 5% of all days in Bitcoin's history have fallen (meaning the price was extremely close to, or below, the Realized Price)
Q10 = the same calculation, but for the lowest 10% of days
In simpler terms: if we look at Bitcoin's entire history and measure how far the price was from the Realized Price on each day, Q5 is the level that price has only dropped to, or below, on 5 out of every 100 days throughout history. So reaching this level is, statistically, a rare and extreme event.
The same logic applies to Q10, except the range is a bit wider (the lowest 10% of historical days instead of 5%).
Power Law Regression Model and Quantile Oscillator
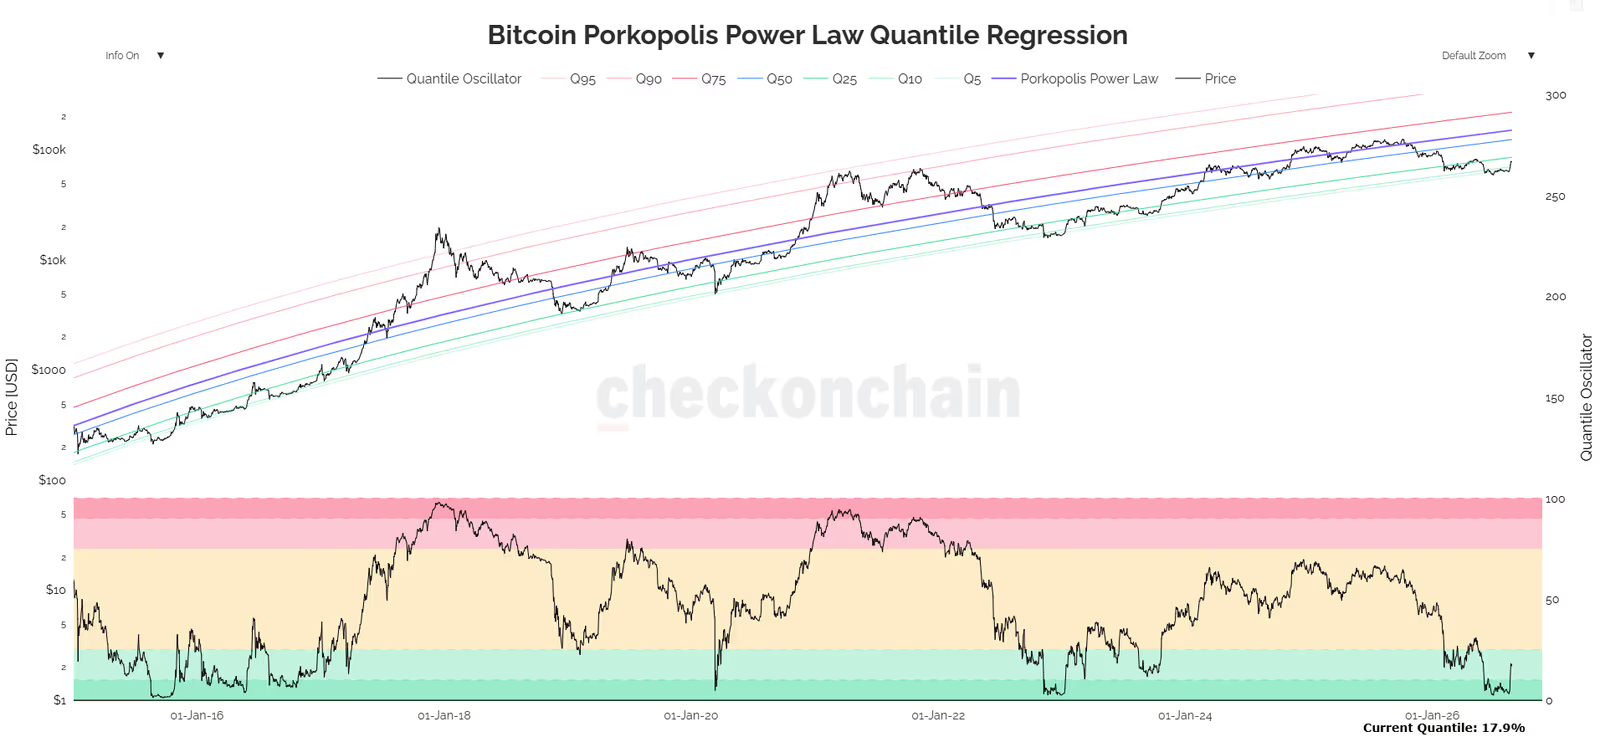
This model is based on a mathematical theory rather than a simple ratio like MVRV. In 2018, economist Matthew Mezinskis (of Porkopolis Economics), inspired by posts from a user going by the name Trolololo, published a model showing that Bitcoin's price follows a power law pattern over the long run.
Main trend line:
Where:
Price = the price of Bitcoin (dependent variable)
Days_Since_Genesis = number of days since the genesis block (independent variable)
A = scale coefficient
n = the exponent, or growth rate (roughly close to 5.7)
To fit this model, ordinary least squares (OLS) regression is used on a logarithmic scale.
Quantile bands of the model (Quantile Regression):
Instead of using a simple standard deviation, a separate regression is fit for each quantile (for example Q5 or Q95) using a Pinball Loss cost function. The result is a set of asymmetric curves that fit Bitcoin's skewed behavior better.
Quantile Oscillator:
This oscillator shows the current position of the price on a scale of zero to one hundred:
At the time this article was written, the oscillator reading was 17.9%, meaning the price was sitting between the Q10 and Q25 bands, which is considered a relatively cheap zone.
Important notes on this model:
Limited data: the model is based on a theory, and since only about two full cycles have passed since it was introduced in 2018, there is a risk of overfitting. More data is needed for real confidence in it.
Two-way use: on the positive side, it is not only useful for spotting bottoms. During uptrends too (for example 2015 to 2017), whenever the price traded around the Q5 or Q10 band, it marked attractive buying zones.
If we assume this theory holds true, the $53,000 to $63,000 range looks attractive for buying according to this model. This figure is simply a reading from this particular model, not a certainty.
Part Two: Holder Behavior and Supply Distribution at the Bitcoin Bottom
Most of the network's daily transactions involve coins that are less than three months old. But the market's real balance shifts when long-term holders (coins older than 155 days, referred to as LTH) show a particular reaction. Their behavior usually reflects the market's broader trend better than short-term holders do.
Long-Term Holder Realized Price (LTH Realized Price)
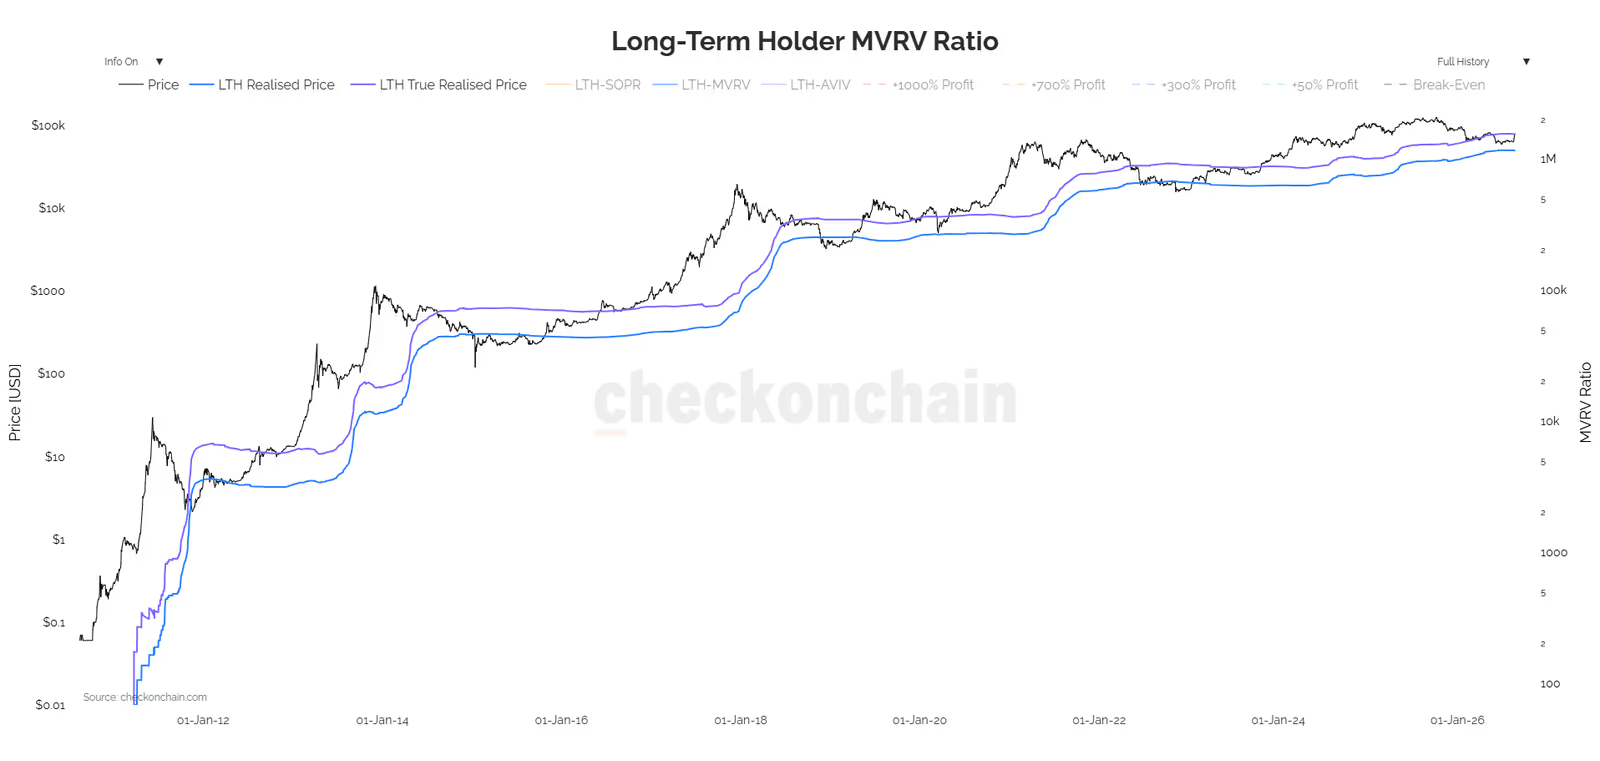
This figure shows the average purchase price of all LTH coins, including coins that are lost or forgotten.
Adjusted version (LTH True Realized Price)
This version removes coins that are fully inactive and likely lost from the calculation, giving a more realistic picture of active investors' behavior.
At the time of writing, these two figures were around $49,700 and $78,300 respectively. Based on the True Realized Price, long-term holders have been at a loss for more than three months. But based on the standard model (which also counts lost coins), they are still, on the whole, in profit.
Realized Profit and Loss (LTH Realized Profit/Loss)
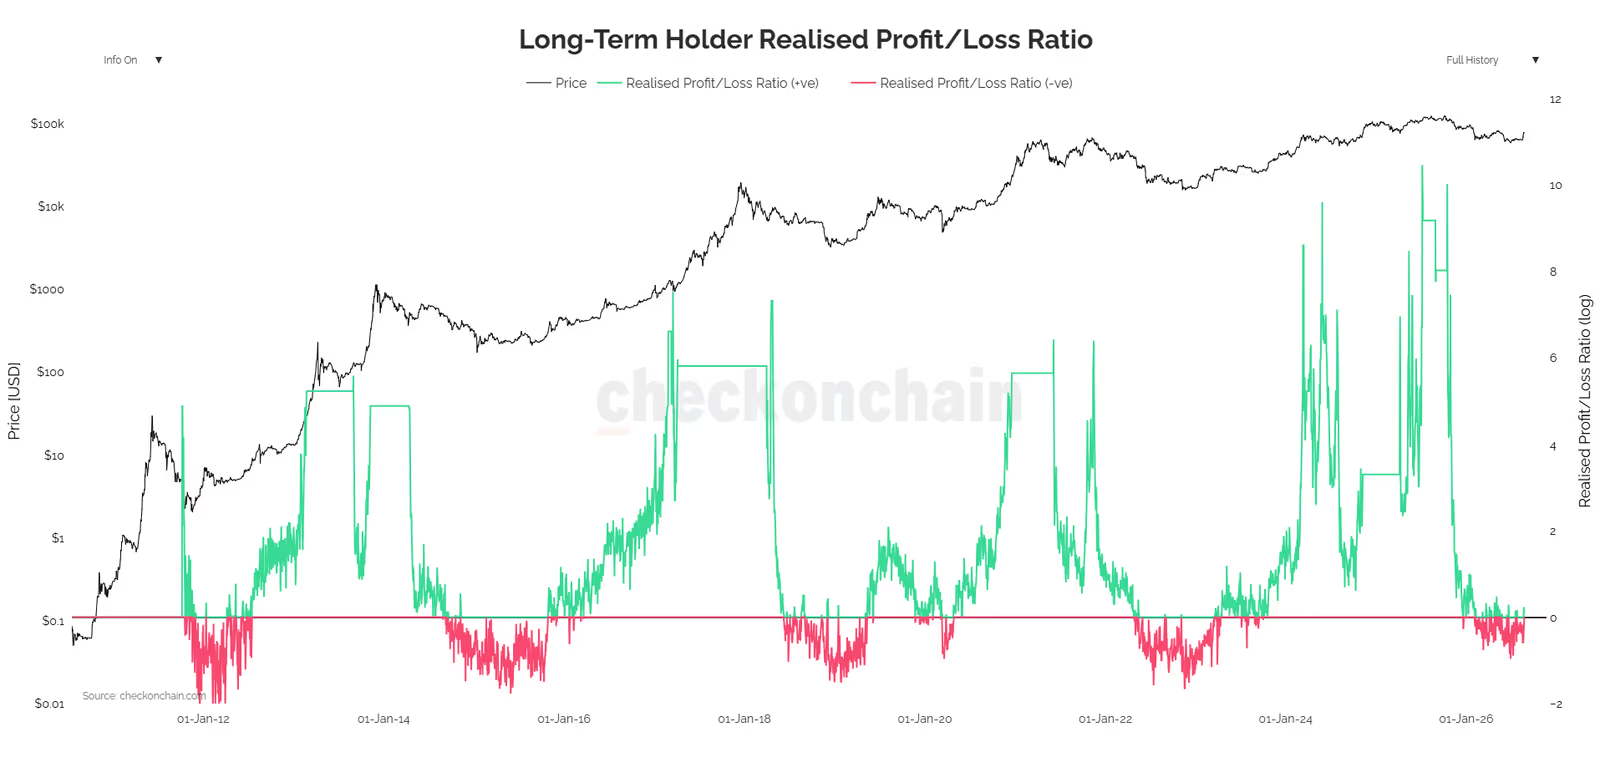
This indicator shows how much profit or loss is locked in when long-term holders move their coins.
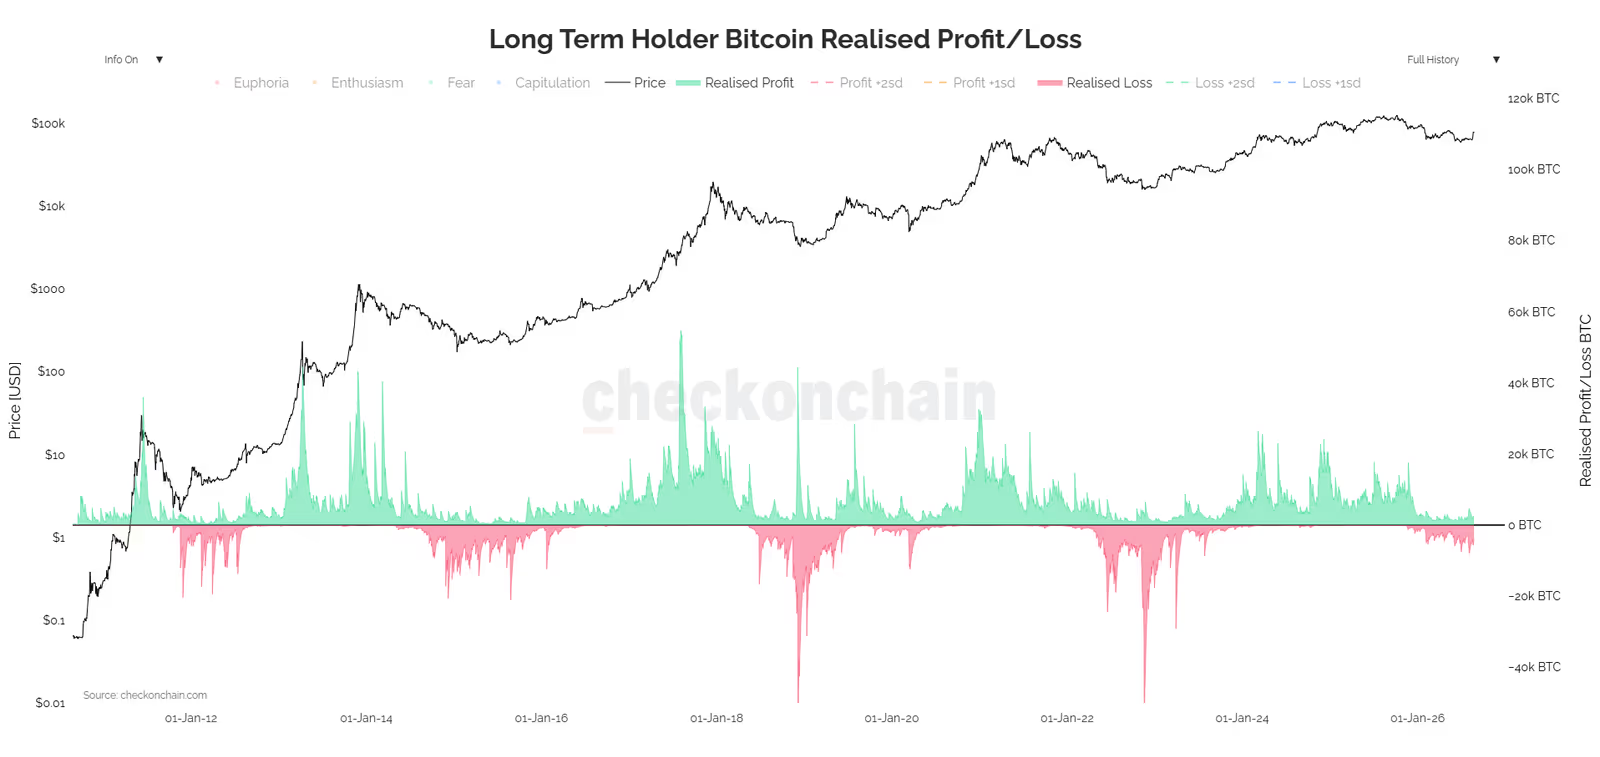
Deep green peaks signal that the market is close to a top. Deep red/pink peaks signal capitulation and closeness to a bottom. This means that people who bought at the previous top, and are now (after 155 days) classified as LTH, are capitulating at the market bottom and selling at a loss.
LTH-SOPR and the Profit-to-Loss Ratio
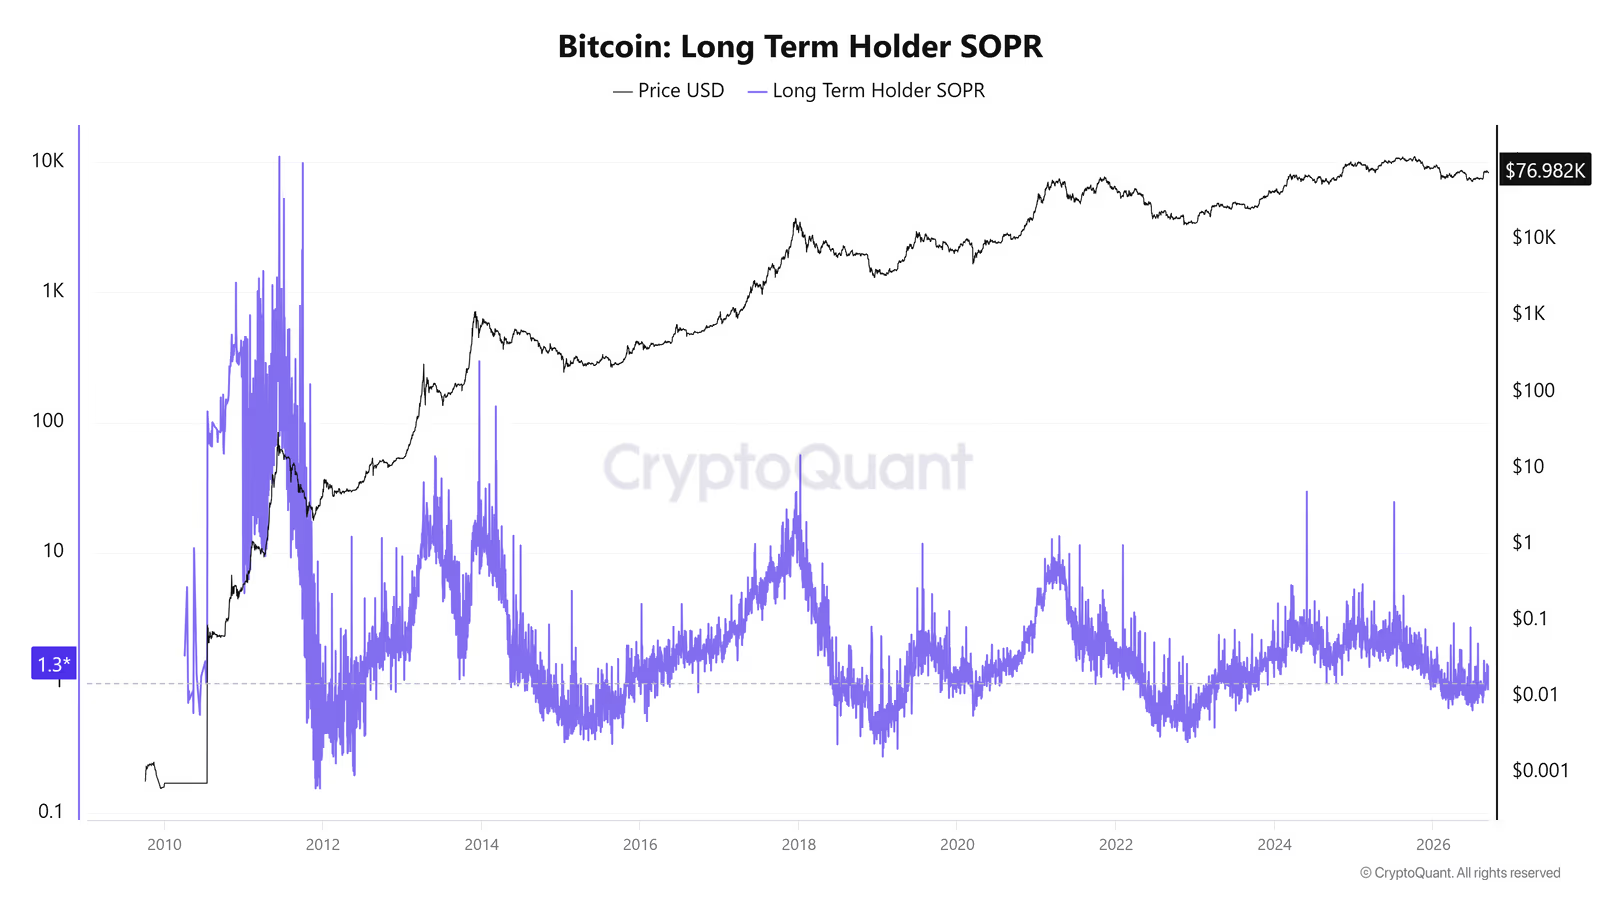
A number above 1 means holders are selling at a profit; below 1 means they are selling at a loss.
As this ratio approaches zero, it shows that losses are dominating the market, meaning long-term holders near the bottom are exiting at a loss, or with very thin profit margins.
What does LTH behavior look like at the bottom of a downtrend?
Putting these four indicators together reveals a clear, repeating pattern that has shown up in nearly every historical Bitcoin bottom:
Step one: the price moves toward, or even below, the LTH Realized Price. This means even long-term holders, on average, are moving into a loss, not just new buyers. This shows that selling pressure has reached even the deepest, most experienced layer of the market.
Step two: LTH Realized Profit/Loss prints a deep red peak. This means long-term holders, who generally bought at previous price tops, start selling at a loss instead of holding. Psychologically, this is exactly the moment referred to in the market as capitulation.
Step three: LTH-SOPR drops below 1 and the profit-to-loss ratio moves toward zero. This means almost no group in the market is booking meaningful profit anymore; everyone is either at a loss or exiting with a very thin profit margin.
The key point here is that these three events usually do not happen at exactly the same time; they tend to occur one after another, and seeing all three together (not just one of them) gives a stronger signal that a bottom is near. If the price only reaches the LTH Realized Price but heavy loss-selling (the pink peak in the Realized P/L chart) has not shown up yet, the market has probably not reached full capitulation, and it could still go lower.
In simple terms: a real Bitcoin bottom usually forms where the people who bought at the tops, who have kept holding and effectively become the market's long-term holders (LTH), finally get worn out and sell at a loss. As long as this group is still holding and waiting, the downtrend is more likely to continue.
Bitcoin Supply in Profit
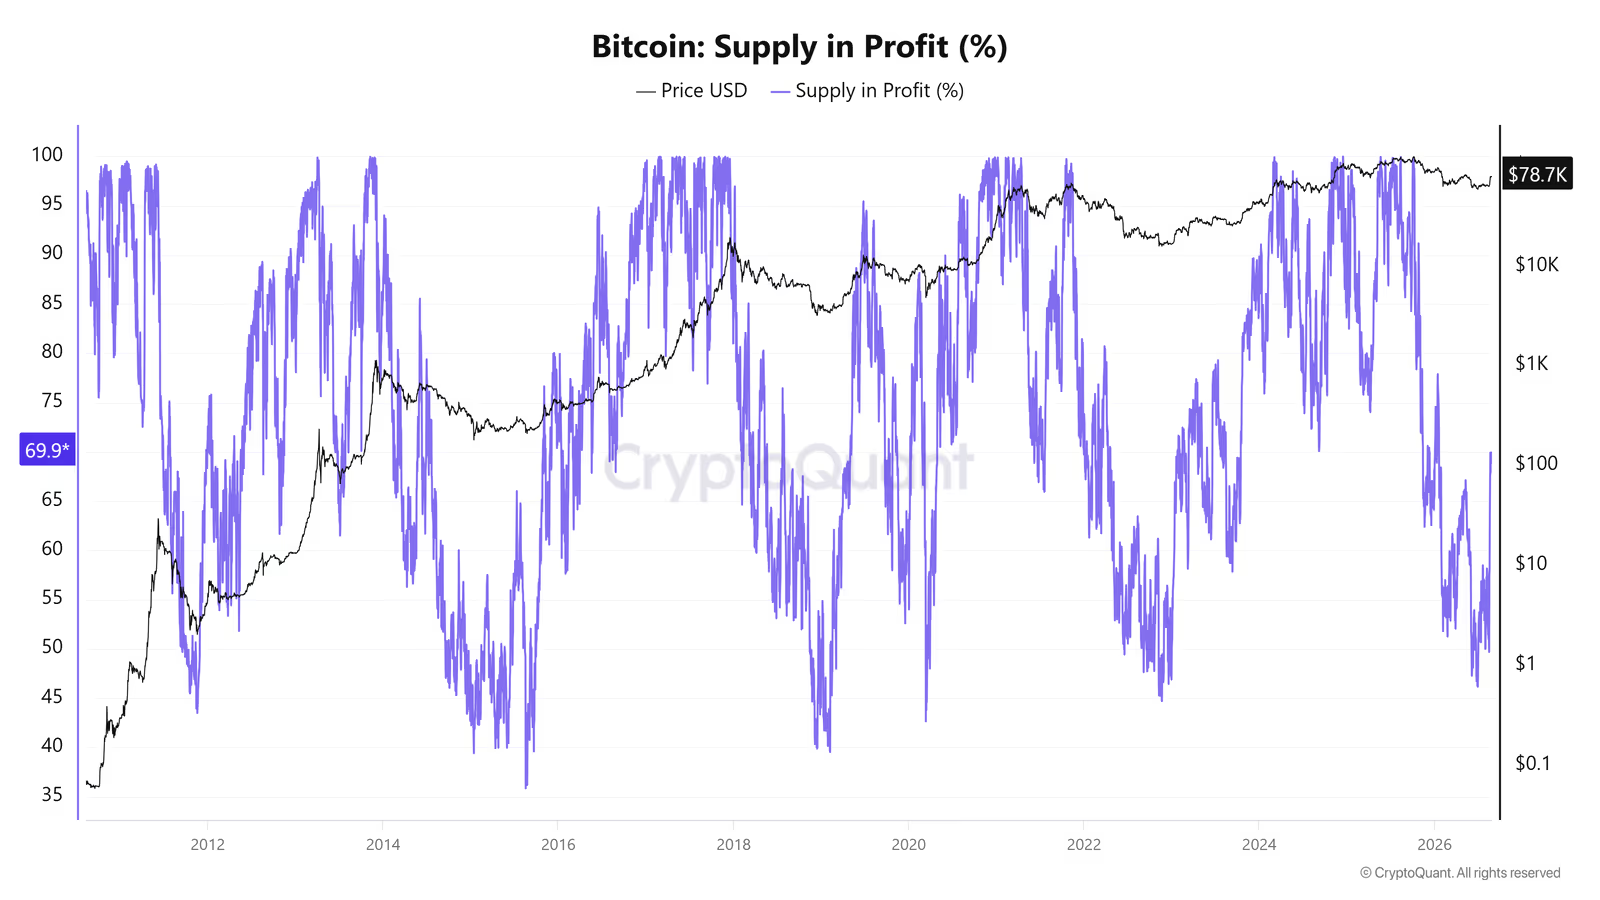
An interesting question this indicator answers is: is everyone really at a loss at the market bottom? The answer is: no. Data shows that in most downtrends, even close to the market bottom, 40% to 50% of circulating Bitcoin is still in profit.
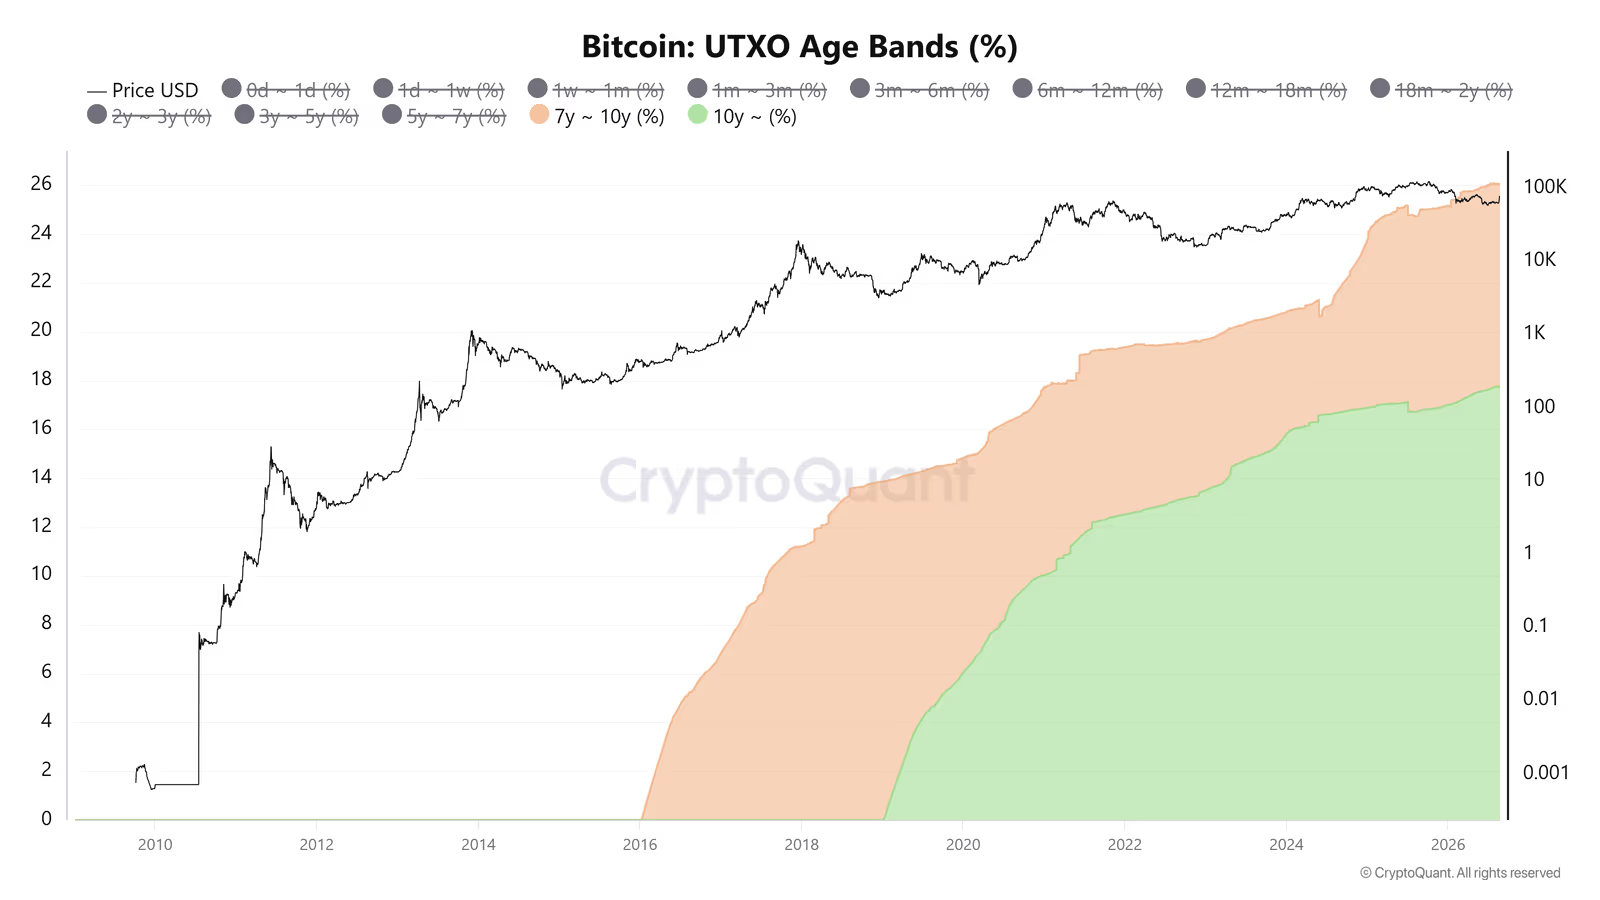
The reason lies in the age structure of coins (UTXO Age Bands):
Coin age group | Share of total supply | Approximate average purchase price |
|---|---|---|
Over 10 years | More than 17% | About $120 |
7 to 10 years | About 9% (out of 26% over 7 years) | About $6,430 |
Over 7 years (both groups combined) | 26% | Under $20,000 (pessimistic assumption) |
Even under a pessimistic assumption that all coins over 7 years old were bought at the 2017 top (around $19,800), this 26% would still remain in profit as long as the price doesn't fall below $20,000. That's why expecting the supply in profit to drop below 30% to 40% at the market bottom is not a realistic expectation.
Part Three: Mining Economics
This section covers four indicators that all tell one shared story: Bitcoin's production cost from a miner's point of view, and when miners start breaking under financial pressure.
Monetary Premium Over Production Cost (ThermoPrice)
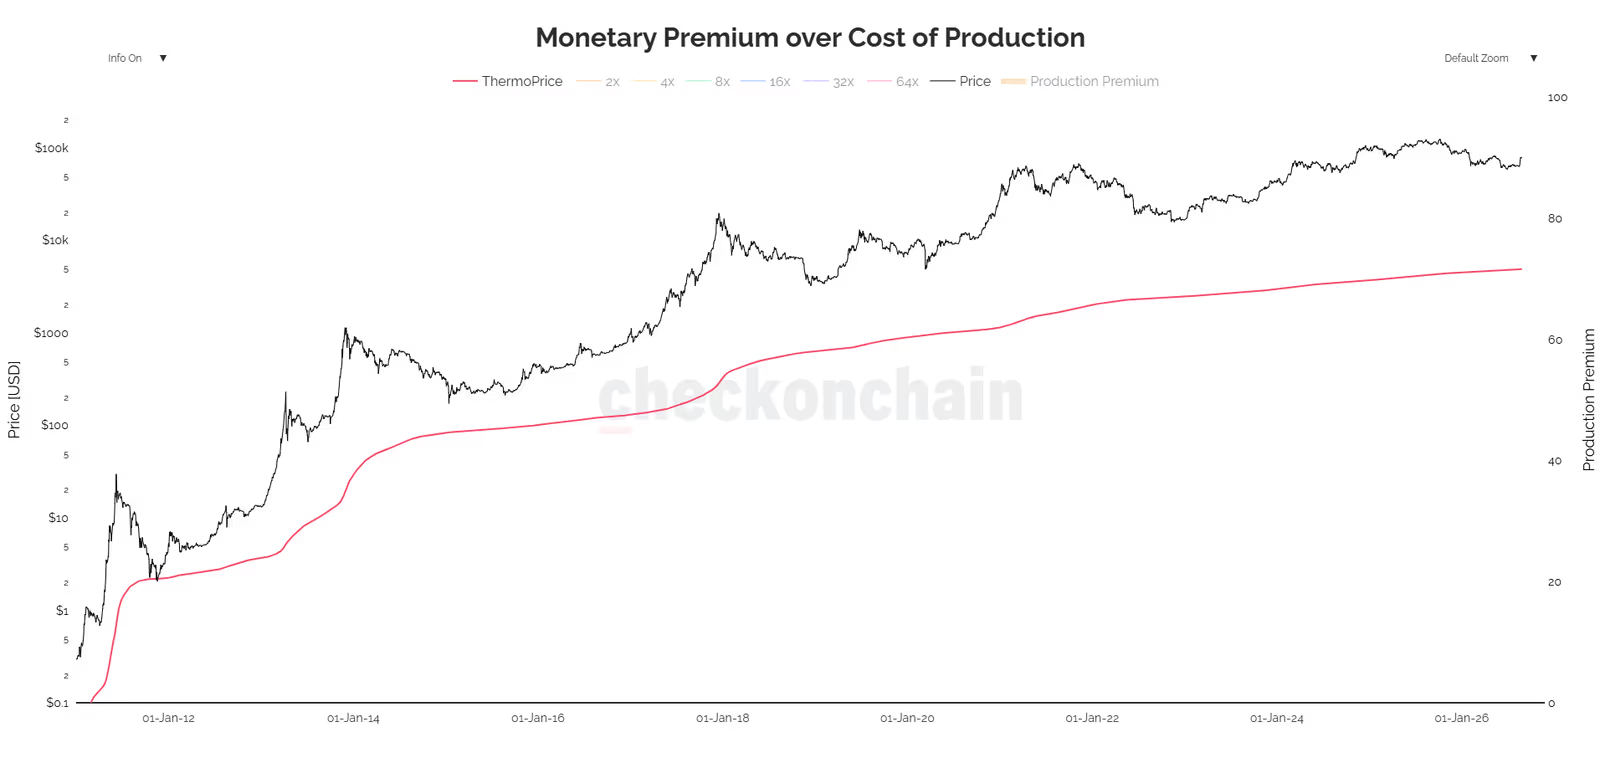
This indicator compares the market price against a cumulative, historical measure of Bitcoin's production cost called ThermoPrice.
Thermocap is the total dollar value of all coins paid out to miners since the network began (block rewards plus transaction fees):
ThermoPrice is calculated by dividing Thermocap by the circulating supply:
The monetary premium is the gap between the market price and ThermoPrice, meaning how much extra, speculative value the market is placing on top of Bitcoin's raw historical production cost.
Limitations of this indicator:
Slows down over time: since this indicator is an average across all of history, the older the network gets, the heavier the weight of the past becomes, and the indicator becomes less sensitive to recent changes (the ThermoPrice line has been nearly flat since around 2018).
Ignores halving effects: the block reward is cut in half every four years, but Thermocap does not adjust for this drop in new supply quickly enough.
Point-in-time pricing problem: each coin is valued at the price on the day it was mined, not at the actual electricity and hardware cost of that day. Between 2009 and 2012, when Bitcoin's price was near zero, that period's contribution to the calculation becomes negligible, even though mining had real costs back then too.
Cannot decrease: since Thermocap only accumulates, ThermoPrice can never go down, even if mining hardware efficiency improves dramatically.
The result is that ThermoPrice mostly reflects an absolute, historical floor that is far removed from today's actual production cost. To address this, we turn to the next model.
Difficulty Regression Model
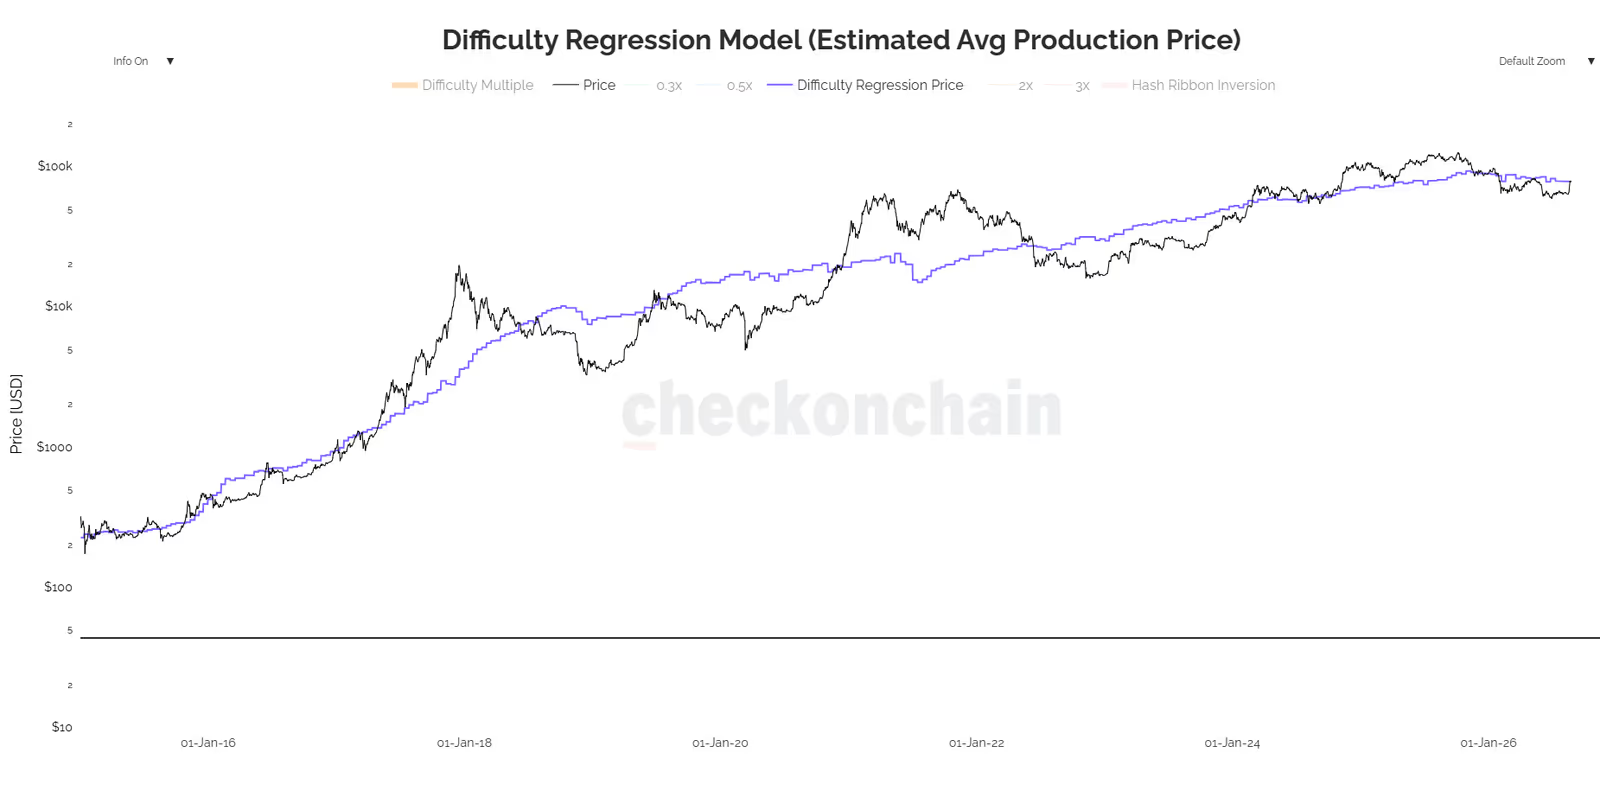
Unlike ThermoPrice, which looks at all of history, this model tries to estimate the current cost of producing one bitcoin based on network difficulty. This figure is often treated as a support level or price floor.
Where a and b are regression coefficients, Scale_Factor is a scaling adjustment, and Circulating_Supply is the total bitcoin in circulation.
The chart has a step-like shape, because network difficulty adjusts every 2,016 blocks (about two weeks) and stays constant in between.
Limitations of this model:
Ignores technological progress: the base assumption of this model is that a given difficulty level corresponds to a fixed dollar cost, but this assumption breaks down as technology improves and ASIC miners become more efficient. If the model isn't regularly refit with new data, it drifts away from reality.
Does not show an exact bottom: the price reaching the mining cost is not necessarily the market bottom; the price can stay below this line for a long time.
Miner resilience: as costs rise and prices fall, some miners gradually shut down, which helps bring the network back into balance.
Comparing the two production-cost models:
Feature | ThermoPrice | Difficulty Regression Model |
|---|---|---|
Type of calculation | Cumulative average over all history | Estimate of today's cost based on current difficulty |
Sensitivity to time | Very slow, nearly flat after a few years | Relatively fast (updates every 2 weeks) |
Economic concept | Weighted average mining cost across all history | Marginal cost of mining today |
Effect of technological progress | Mostly ignored | Partly accounted for (if refit regularly) |
Puell Multiple
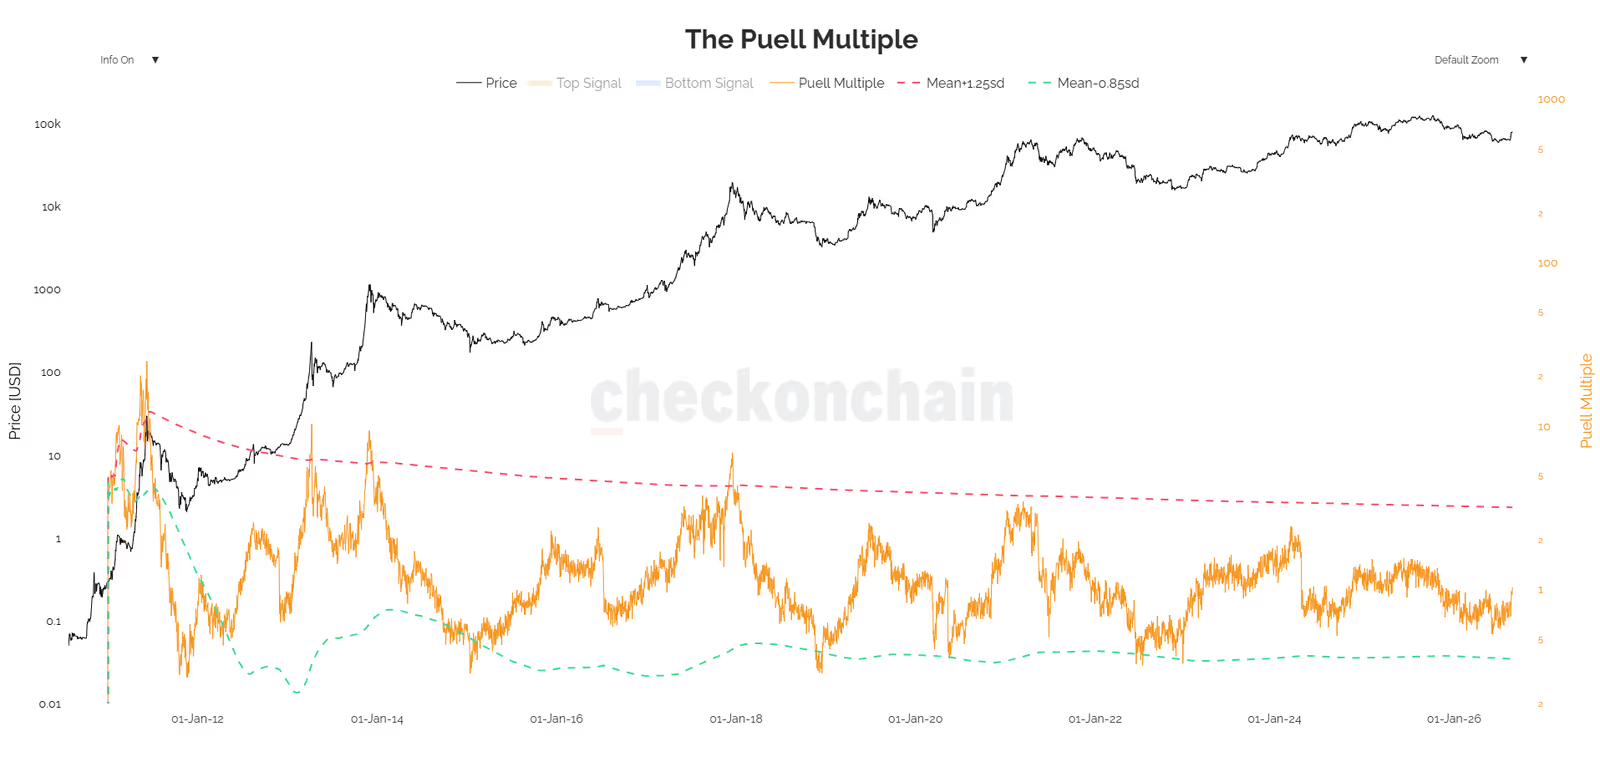
Instead of production cost, this indicator looks at miners' gross revenue, comparing today's revenue with the yearly average.
Statistical bands:
The reason the coefficients are asymmetric (1.25 versus 0.85) is that the data distribution is skewed to the right. The mean and standard deviation are also calculated on a rolling basis, to account for the non-stationary nature of the data and the network's gradual maturity.
A sharp drop in miner revenue, and the selling pressure that comes with it, has historically been a good signal for a price bottom. Even widespread attention to this same signal can, on its own, boost demand and help the price recover.
Hash Ribbons
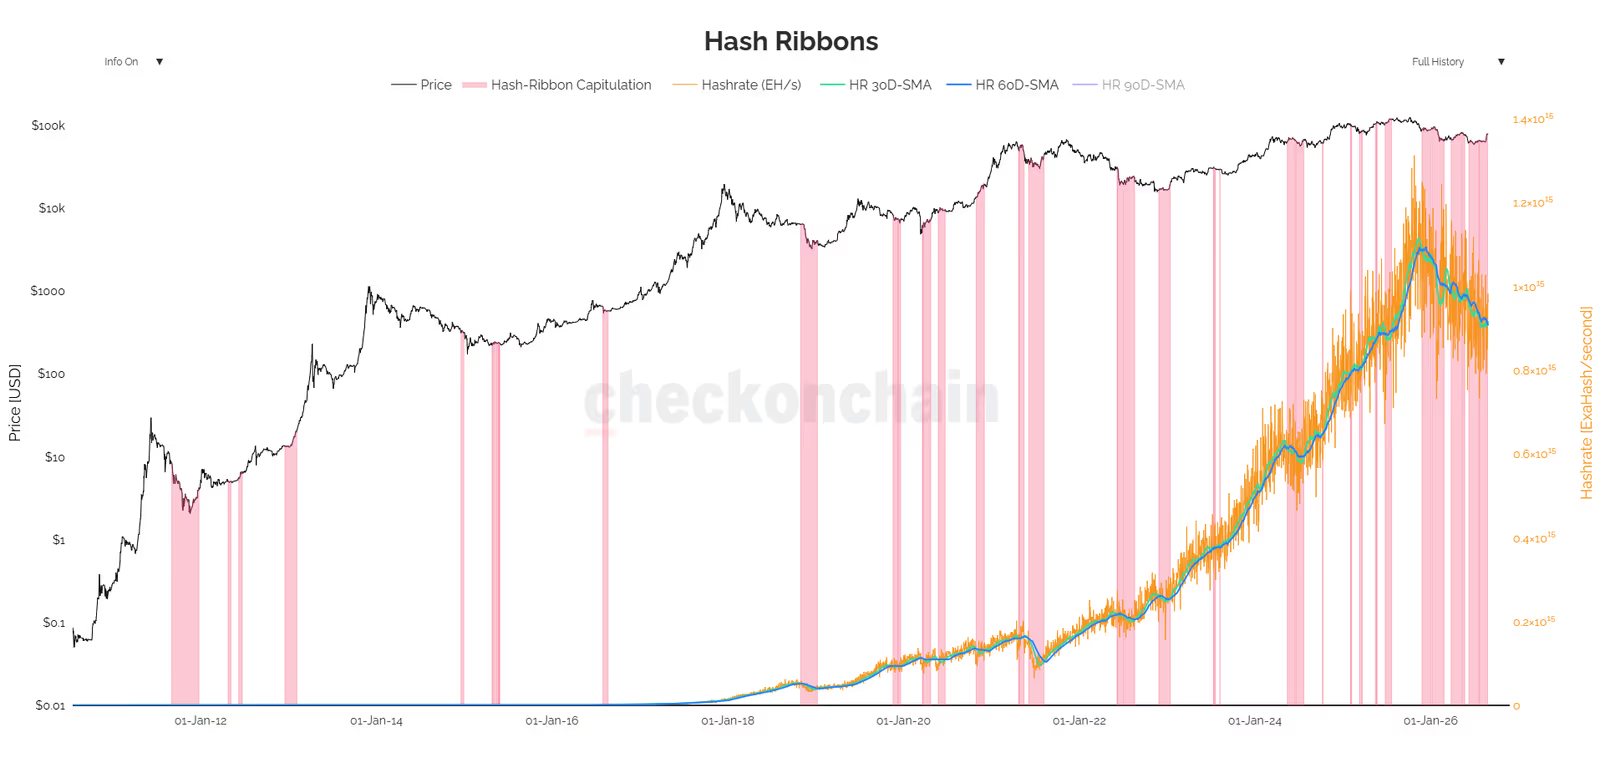
This indicator is designed to identify the moments when weak, inefficient miners get pushed out of the network, known as miner capitulation. As the price falls, higher-cost miners shut down their machines and the network's hash rate drops.
In other words, the capitulation signal fires when the 30-day moving average of the hash rate falls below the 60-day moving average.
As weak miners exit, network difficulty drops and the remaining miners become more profitable. This usually happens near price bottoms and is a completely normal part of downtrends.
Notes and limitations:
High noise in recent years: between 2024 and 2026, due to intense competition in the mining industry, this signal has fired repeatedly and carries more noise than it used to.
Delayed effect: a price drop does not always cause an immediate drop in hash rate, since miners tend to hold on for a while before giving up.
Doesn't show position within the trend: this indicator doesn't tell you where you are in a downtrend (early, middle, or late stage). Indicators like MVRV are more reliable for that purpose.
Complementary use: on its own, this tool is not enough for a buy or sell decision; it should only be used alongside other indicators to increase confidence.
Summary: When All the Indicators Line Up
On-chain analysis is like putting together the pieces of a puzzle. None of these 9 indicators gives a definite answer on its own, but each one shows a different angle of market reality: the behavior of long-time buyers, the financial pressure on miners, and the distance between price and historical averages.
The key point is that when several independent indicators point to the same conclusion at the same time (often called confluence), the odds of being close to a valid bottom go up. The table below summarizes the ranges covered in this article:
Indicator | Range or current status (at time of writing) |
|---|---|
MVRV Ratio | Has not reached 1 yet; estimated range around $52,000 to $53,000 |
Realized Price Quantiles (Q5/Q10) | Historical statistical ranges, depending on real-time data |
Power Law Model | Estimated range of $53,000 to $63,000 |
ThermoPrice | Absolute historical floor, far below today's actual cost level |
Difficulty Regression | Estimated current production cost |
LTH Realized Price / True Realized Price | About $49,700 and $78,300 |
Supply in Profit | Usually between 30% and 50% at historical bottoms |
Puell Multiple | Near the lower band signals financial pressure on miners |
Hash Ribbons | An active signal means weak miners are exiting |
That said, one important point should not be forgotten: market structure is always changing. The arrival of spot ETFs is one of the factors that has altered the traditional equations from previous cycles. No model, however precise, replaces proper capital management. Combining these data points intelligently with a disciplined, regular investment strategy is the best way to use these tools, not trying to predict the exact point of a price reversal.